Advancing osteoporosis opportunistic screening: multicenter validation of a deep learning algorithm using abdominal CT scans
Summary
Objectives To develop and do multicenter validation on an algorithm that screens for osteoporosis from abdominal CTs. Methods This is a diagnostic accuracy study with retrospective data from January 2022 to July 2022 consisting of two steps: a segmentation step of the lumbar vertebral bodies, involving outpatient non-contrast abdominal CTs from Diagnósticos da América S/A (Dasa), and a multicenter validation step incorporating data from four additional institutions. The segmentation employed a 2D UNet with a ResNet34 backbone. We determined the Pearson correlation coefficient (r) between the mean of the slices’ mean attenuations (MSMA) on CT scans against the bone mineral density (BMD) on recent DEXA scans, calculated AUCs and performance metrics for osteoporosis prediction, including 95% confidence intervals, and evaluated calibration plots. Results The multicenter validation included 504 participants (median age, 66 years, interquartile range 56–72; 388 women). A linear regression analysis showed an r of 0.62 (95% CI, 0.56–0.67) between MSMA (HU) and BMD (g/cm 2 ). The AUCs (95% CI) for distinguishing between normal and osteoporosis were 0.96 (0.89, 1.0) for the internal dataset and 0.82 (0.74, 0.89) for the external dataset, and the performance metrics (95% CI), for a globally optimized threshold of 202.6 HU, were 100% sensitivity (44, 100) and 91% specificity (84, 95) for internal data and 79% sensitivity (61, 90) and 81% specificity (76, 84) for external sites. MSMA was independently associated with osteoporosis on a mixed-effects logistic regression analysis. The model showed good calibration, with Brier score of 0.054. Conclusion We developed and performed a multicenter validation of a DL model for osteoporosis prediction on CT. Graphical abstract
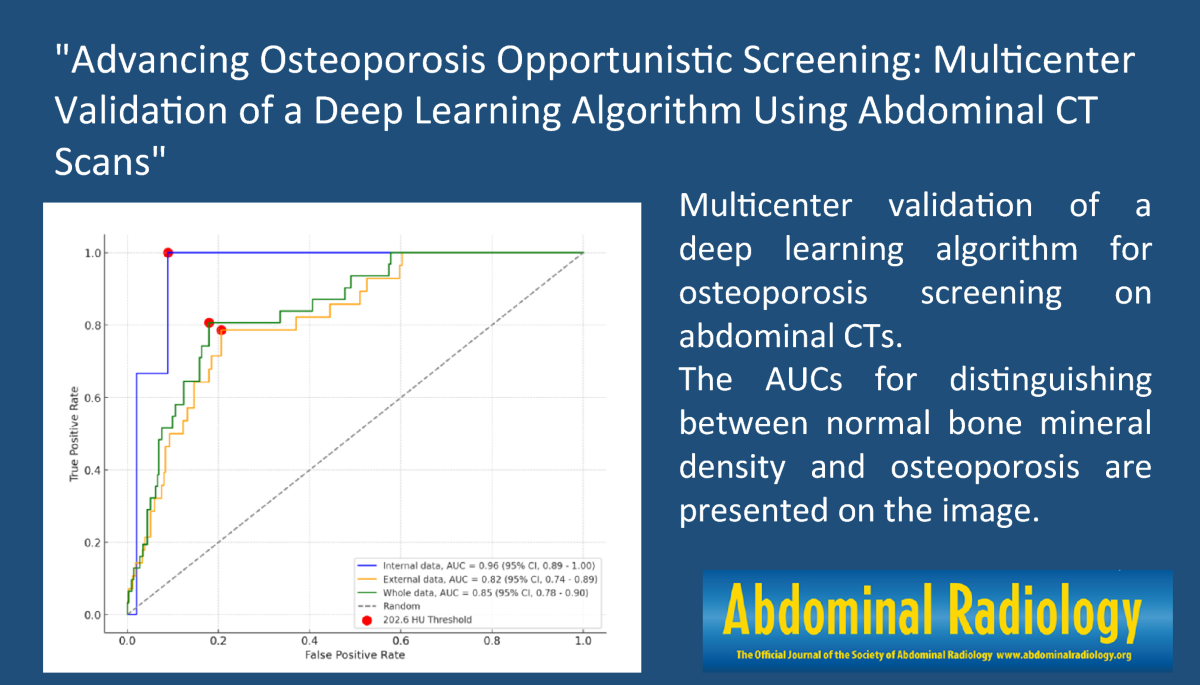
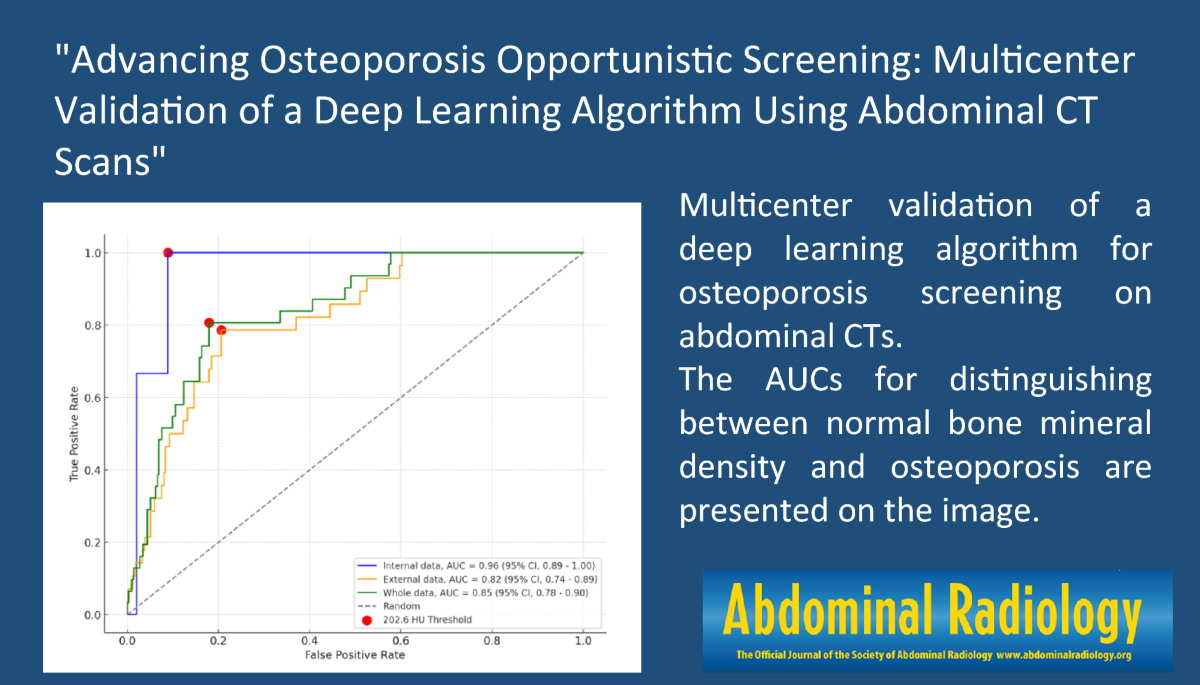
Graphical abstract. Multicenter validation of a deep learning algorithm for osteoporosis screening on abdominal CTs. The AUCs for distinguishing between normal bone mineral density and osteoporosis are presented on the image.
Introduction
Osteoporosis, a systemic skeletal disorder characterized by reduced bone mass and the microarchitectural deterioration of bone tissue [1], poses a significant public health challenge globally [2, 3]. It increasingly leads to a higher risk of fractures, particularly in the hip, spine, and wrist, significantly impacting the quality of life in the aging population worldwide. There has been an increase, from 1990 to 2019, in the total number of deaths attributable to low bone mineral density (LBMD) and LBMD-related fractures [4]. The silent nature of the disease, often remaining undetected until a fracture occurs, underlines the importance of early detection and intervention [5].
Traditional methods for diagnosing osteoporosis predominantly rely on DEXA scans to measure bone mineral density (BMD) [6]. However, the limited availability of DEXA in certain regions, coupled with its cost, poses a barrier to widespread osteoporosis screening [7].
The development of concept of opportunistic screening stems from efforts to reduce unnecessary diagnostic imaging and the pursuit of innovative strategies to enhance the utility of imaging procedures [8]. Specifically, abdominal (and thoracic) CT scans, have emerged as a promising tool for opportunistic osteoporosis screening [9–15]. Initially centered on manual measurement techniques, it has progressively evolved to embrace automated methods, particularly deep learning (DL) approaches [16–31].
Some osteoporosis screening CT methods are based on region-of-interest (ROI) placement in lumbar vertebrae, most commonly a circular or elliptical ROI within the trabecular compartment of L1 [12, 13, 18, 22]. While clinically useful, these ROI-based approaches may suffer from limited reproducibility, as they represent only a fraction of the vertebral trabecular volume and don't include cortical bone. Whole-lumbar volumetric methods might provide a more comprehensive assessment of bone attenuation and volumetric BMD [29–31]. These approaches not only improve reproducibility but also show strong correlations with fracture risk [29, 30].
Albeit these recent advances on osteoporosis detection with DL, very few algorithms have undergone external validation. Accordingly, this paper focuses on the development and multicenter validation of an algorithm designed to predict osteoporosis from abdominal CT scans.
Methods
This is a diagnostic accuracy study with retrospective data, approved by each local Institutional Review Board (IRB) with a waiver for informed consent. It was carried out through a partnership among multiple institutions centralized by the Bunkerhill Health consortium. The study is reported in accordance with the STARD 2015 guidelines [32]. A completed STARD checklist is provided in the Supplementary Material.
The methodology comprises two main components: a raw segmentation step and a multicenter validation step.
Raw segmentation step
The primary goal of this step was to delineate the vertebral bodies of the lumbar spine in non-contrast abdominal CT scans. Cortical and trabecular bone are included in the segmentations.
Sample selection, data split and annotations
We utilized a retrospective dataset of outpatient scans acquired between January and March 2022 from Diagnósticos da América S/A (Dasa), for various clinical indications. A convenience sample was used because there is no universally accepted method for sample size calculation in deep learning models. Inclusion criteria were patients aged 18 years and older. Scans showing movement artifacts were excluded. The data were divided into training, validation, and testing sets at a 70/20/10 ratio. The reference standard of the segmentations were annotated by MST, a senior radiologist with 10 years of experience.
Training details
A 2D UNet architecture [33] with a ResNet34 backbone [34] was used. The model was initialized with weights pre-trained on the ImageNet database. During the training, a batch size of 32 and an initial learning rate of 10−3 were employed. Dice loss was used because it is well-suited when class distribution is imbalanced, as it aids in achieving a balance between precision and recall. CT images were windowed with a center of 60 HU and width of 400 HU, and then rescaled to an intensity range of [0,1] using min–max scaling.
The only augmentation technique implemented was a vertical flip, ensuring the model's effectiveness for imaging patients in different orientations, including prone positions. Model training incorporated early stopping mechanisms to prevent overfitting, with monitoring of the validation set for improvements in the Dice score. Training was halted if there was no improvement after 10 epochs.
Multicenter validation step
Our multicenter validation step utilized another retrospective, convenience sample, including new data from Dasa, distinct from that used in the initial segmentation step. This dataset was supplemented with data from four additional institutions: University of Alabama (UAB), MedStar, University of California, San Francisco (UCSF), and University Hospitals Cleveland Medical Center (UHH). Anonymization was done by each institution before sending the data to the internal institution. The scans incorporated into the study ranged from October 2021 and July 2022 and spanned a wide range of clinical scenarios, from outpatient visits and inpatient stays to emergency room presentations.
Inclusion and exclusion criteria
Patients who had undergone an abdominal CT scan, which could also include chest and/or pelvis imagery, were eligible. They should have been performed for any reason in patients aged over 18 years. An inclusion criterion was the presence of a non-contrast phase in the CT scan for algorithm inference. Because of their widespread clinical use and availability, DEXA scans, conducted for the respective patient within a maximum interval of six months before or after the CT scan, were chosen as the reference standard. DEXA scans that did not adequately depict the lumbar spine were excluded. Patients with metallic spinal implants, recent spinal surgery and/or vertebral body fractures were excluded. If the assessment was based on a single vertebral body they were also excluded, in line with the 2023 official positions from the International Society for Clinical Densitometry (ISCD) [35].
Main metric definition and formula
For the whole lumbar spine, the segmented axial slices were processed to compute the mean of segmented pixels per slice. The mean slice values were then averaged across all slices, yielding the metric we call the mean of slices' mean attenuation (MSMA), expressed in HU:
MSMA = (1/N) · Σi=1N [ (1/Mi) · Σj=1Mi HUij ]
where, N: number of slices (L1–L5), Mi: number of segmented pixels in slice i, HUij: attenuation value of pixel j in slice i.
We selected MSMA as our primary metric because preliminary testing showed that it provided slightly better sensitivity and specificity, which are widely used in clinical practice, than the global voxel mean (Supplementary Table 1), while yielding similar values for the other performance metrics. It also mitigates potential biases from vertebral cross-sectional area variations, weighting each segmented slice the same.
Statistical analysis
The strength of the association between the MSMA from our segmentation and the BMD of the lumbar spine was assessed using linear regression and the Pearson correlation coefficient was calculated.
The diagnostic capability of the algorithm was further evaluated by calculating the Area Under the Curve (AUC). Site-specific diagnostic performance was examined by calculating AUCs for each institution separately, and results were summarized in a forest plot. Confidence intervals for AUCs were obtained using bootstrap resampling (2,000 iterations, stratified by outcome status).
Performance metrics were calculated using thresholds determined by the Youden J method [36] to identify global optimal cutoffs, and were also evaluated using fixed thresholds derived from internal data. The independent variable was the MSMA obtained from the segmentation, and the dependent variable was the classification of patients based on their spine BMD values. Confidence intervals for sensitivity, specificity, predictive values, and accuracy were calculated using the Wilson score interval method. We additionally constructed Precision–Recall (PR) curves and calculated the area under the PR curve (AUPRC).
To evaluate whether MSMA was independently associated with the diagnosis of osteoporosis, we performed a logistic regression with cluster-robust standard errors. The dependent variable was osteoporosis. The primary independent variable was MSMA (continuous, HU). Models were adjusted for CT acquisition parameters including kVp (continuous), slice thickness (continuous), and scanner vendor (categorical). Robust covariance estimates were clustered by institution to account for within-site correlation.
To evaluate calibration, we generated calibration plots comparing predicted probabilities against observed outcomes and quantified calibration using the Brier score.
Our diagnostic approach focused exclusively on the lumbar spine due to the absence of segmented CT data for other skeletal sites. The categorization relied on the t-score, with values below or equal to −2.5 being considered LBMD/osteoporosis. The reference values were consistent across all institutions. In our study, the t-score calculation was based on a standardized reference sample of young caucasian women [37], aligning with the latest official positions from the ISCD [35].
All statistical analyses were conducted using Python 3.11, utilizing the latest versions of the SciPy, NumPy, Scikit-learn, Pandas, and Matplotlib libraries.
Results
Detailed information regarding the selection process of participants, including the inclusion and exclusion criteria for both the segmentation and validation steps, is systematically illustrated in the STARD (Standards for Reporting of Diagnostic Accuracy Studies) diagram (Fig. 1).
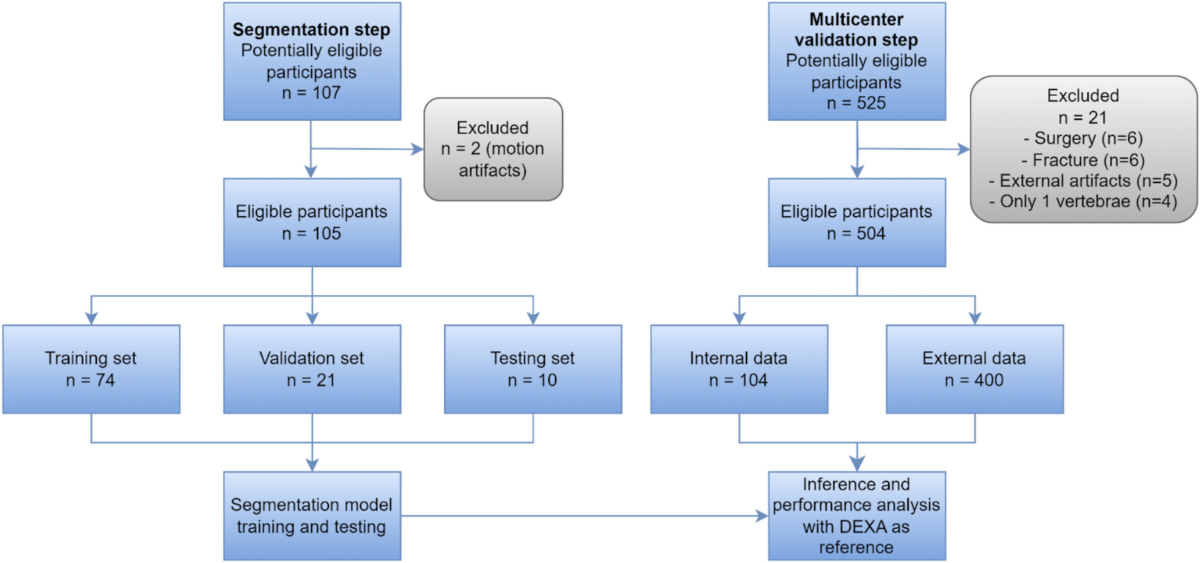
Fig. 1. STARD (Standards for Reporting of Diagnostic Accuracy Studies) diagram illustrating each phase of the study.
Raw segmentation
In the segmentation step, we included 105 participants after applying the exclusion criteria. Two exams were excluded because of motion artifacts.
In assessing the raw segmentation performance of our model, the Dice coefficient achieved a score of 0.998 on the validation set. When applied to the unseen test set, the Dice score remained high at 0.978. It also demonstrated robust performance across various patient orientations, including oblique and prone positions (Fig. 2) and across multiple acquisition settings (Supplemental fig.1). Typical failure examples are also depicted in Supplemental figure 1.
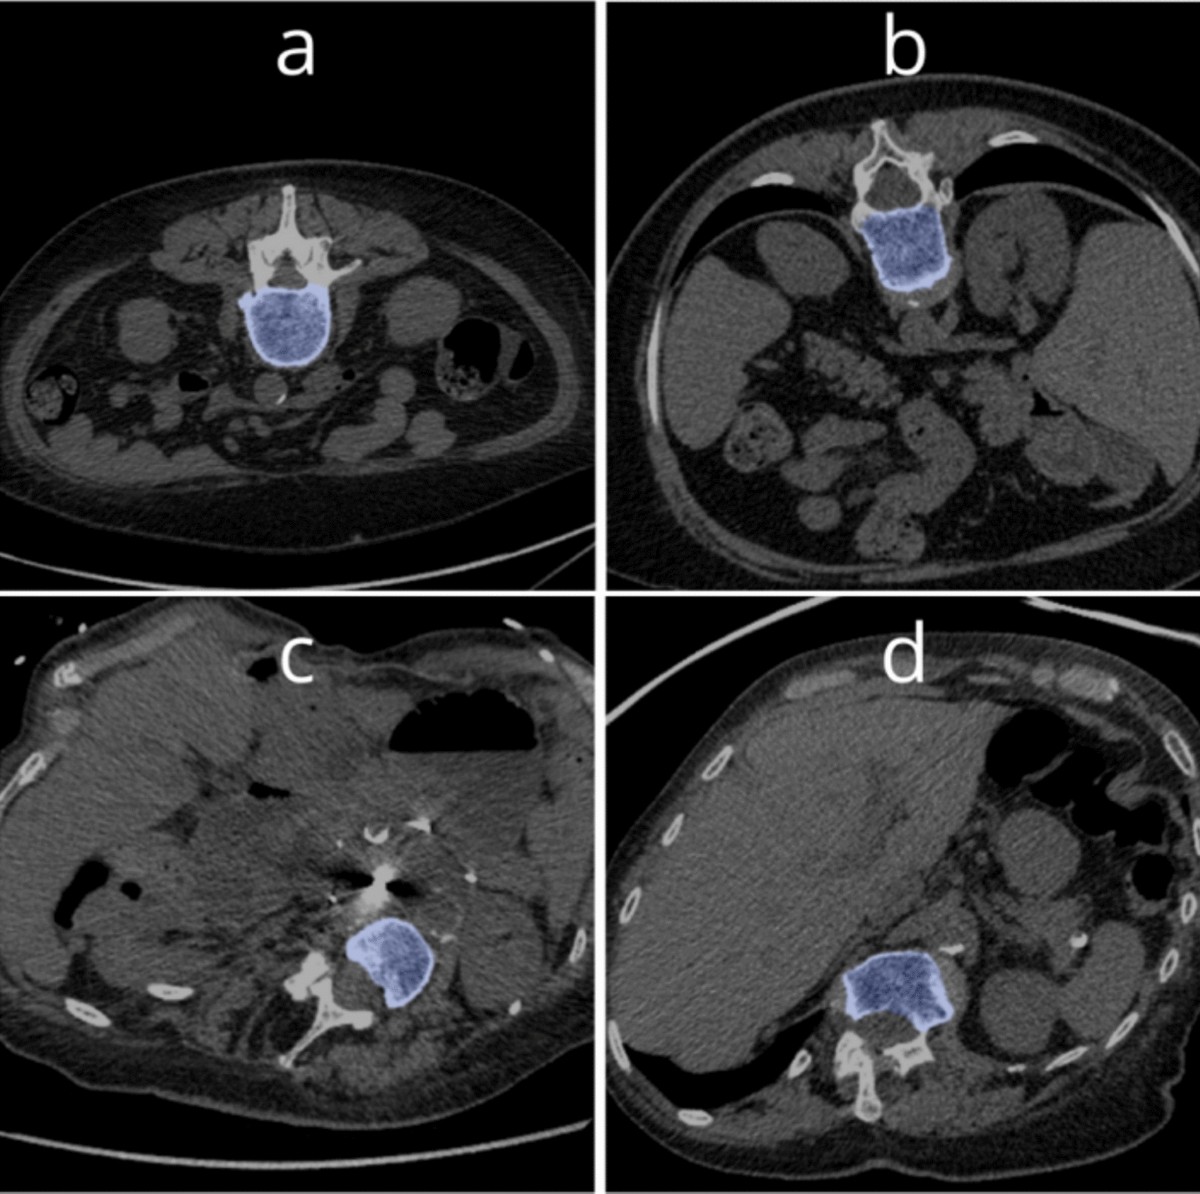
Fig. 2. Examples of segmentations in pronated (a and b) and oblique (c and d) patients.
Multicenter validation
Demographics
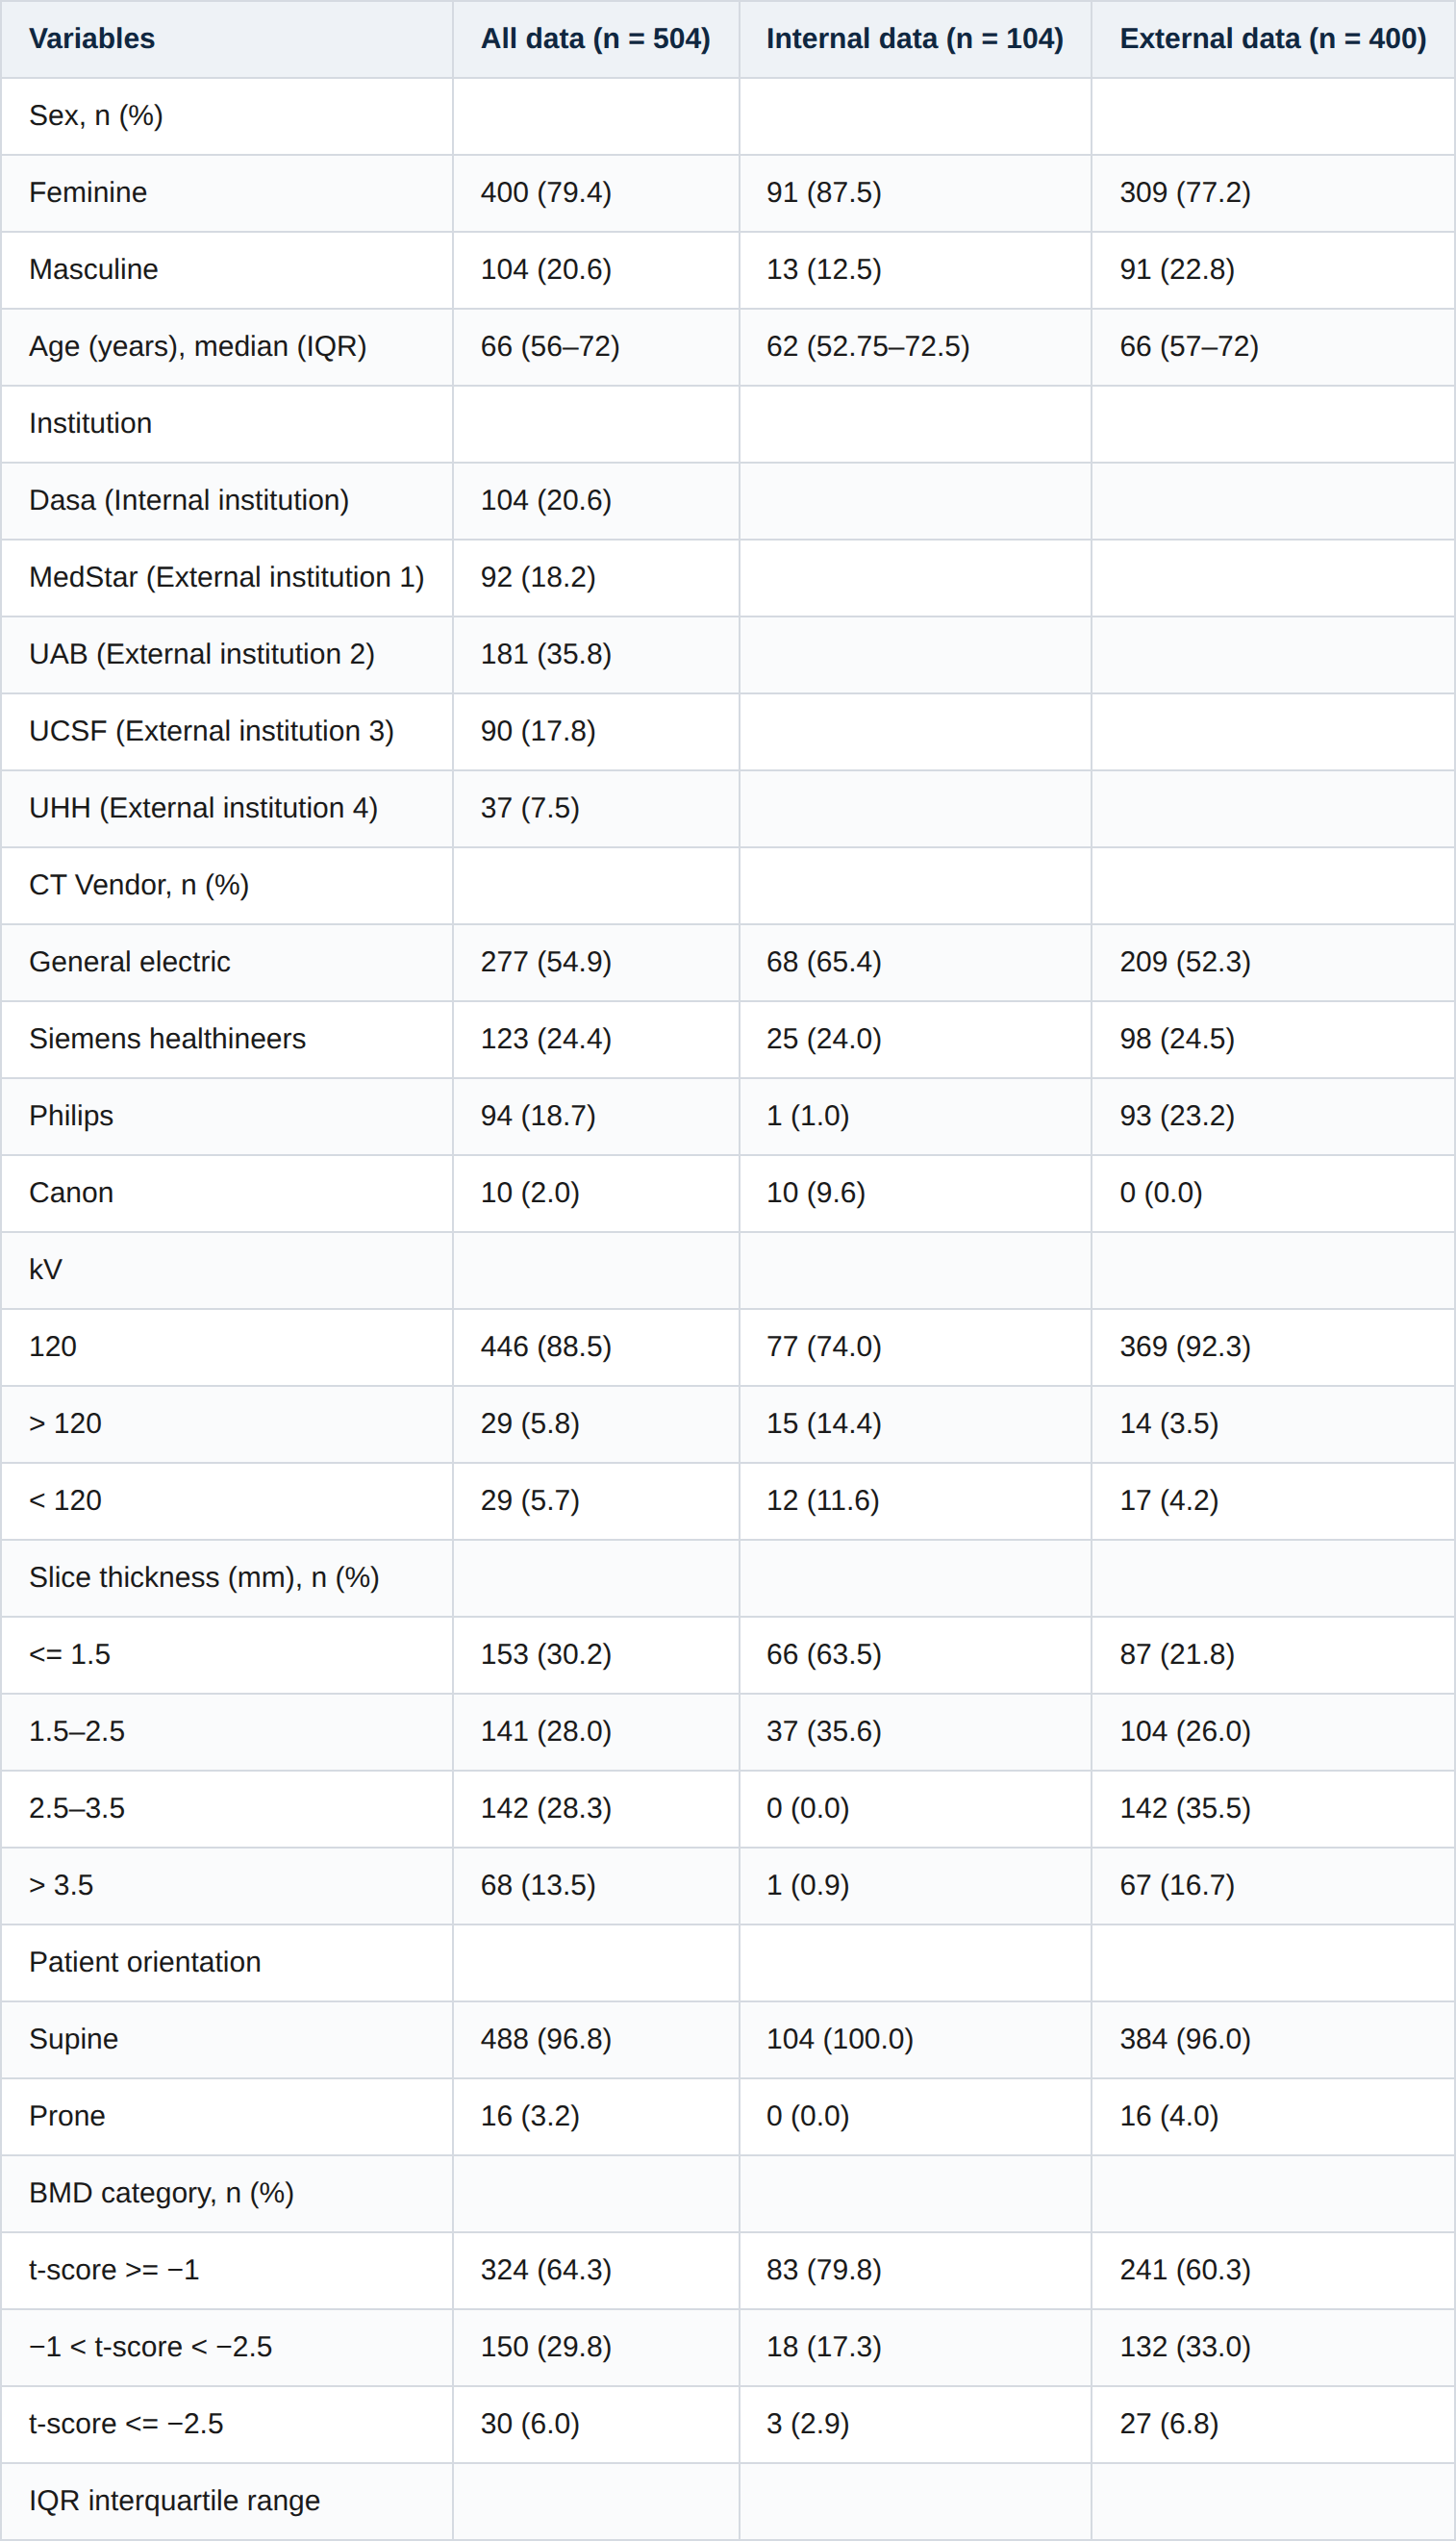
In the multicenter validation step, the number of participants considered for the final sample was 504. This sample consisted of 388 (80%) female patients, with a median age of 66 years (interquartile range 56–72) (Table 1). For this step, 21 cases were excluded: six due to surgeries, six because of fractures, five due to external artifacts, and four because the DEXA scans depicted only a single vertebral body.
Data encompassing diagnostic categories, CT scan vendors, slice thickness for all participants, and segregated details for in-house (Dasa) and external datasets are also systematically listed in Table 1. The CT scans originated from various vendors and were conducted with a range of slice thicknesses. In our dataset, 88.5% of the scans were acquired using a voltage of 120 kV. As for the DEXA scan diagnosis, 35.8% had at least osteopenia, while 6% had osteoporosis. There were 16 exams acquired in the prone position.
Table 1. Characteristics of the multicenter validation sample.
Correlation analysis
A linear regression analysis demonstrated a correlation coefficient (r = 0.62, 95% CI, 0.56–0.67) between the MSMA (in HU from CT scans) and the BMD (in g/cm²) from DEXA scans. When selecting only exams acquired with 120 kV, the coefficient did not change significantly. The equation of the best-fit line was:
BMD (g/cm²) = 0.41 + 2.6 × MSMA (HU)
AUC calculations
The AUC of the Receiver Operating Characteristic (ROC) curves were calculated for various thresholds to predict osteoporosis, with values exceeding 0.8 for both internal and external datasets (Fig. 3). The values were similar when excluding exams acquired with voltages other than 120 kV. Site-level AUCs for MSMA ranged from 0.84 to 0.96, with overlapping 95% CIs across all institutions indicating no major site-specific outlier (Fig. 4).
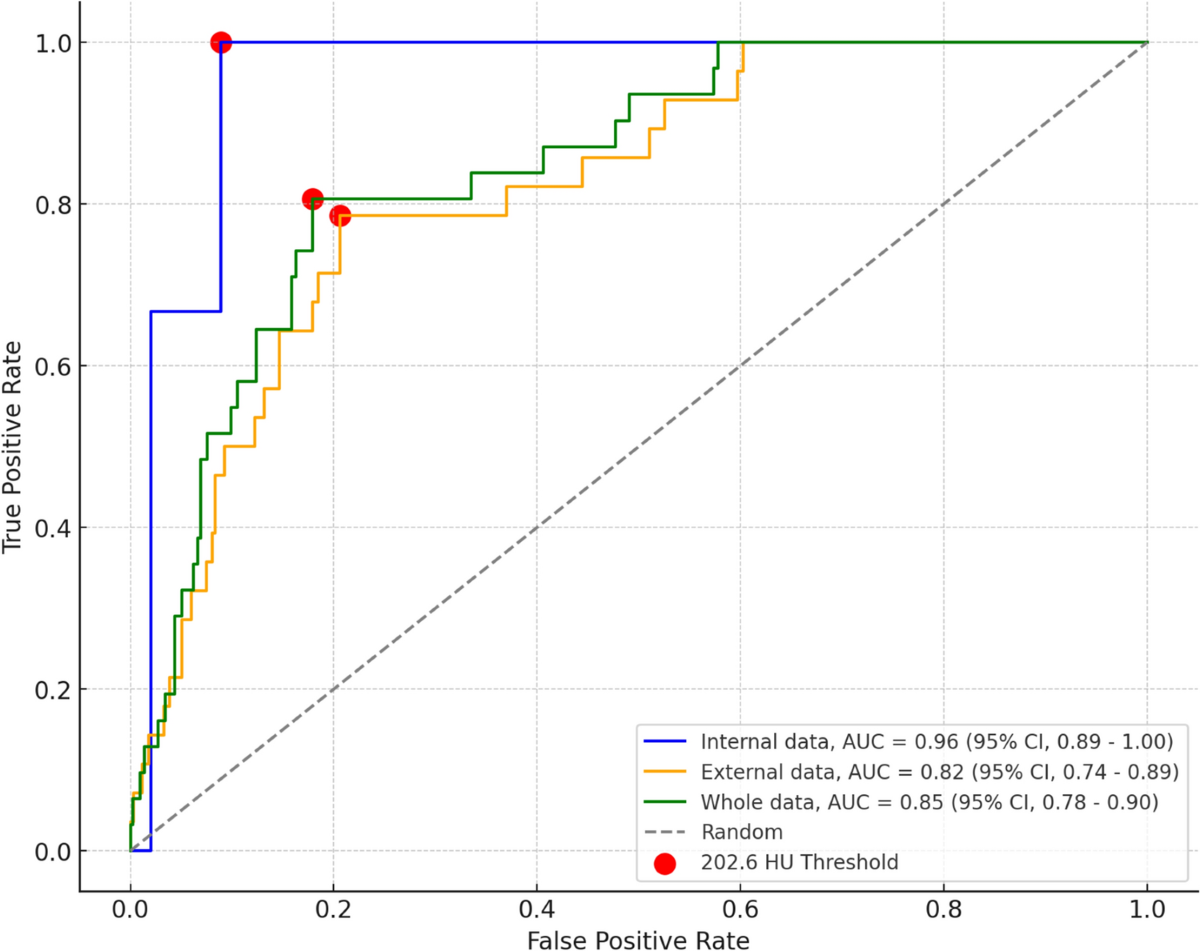
Fig. 3. ROC curve for each dataset for predicting osteoporosis. Red markings correspond to a threshold of 202.6 HU.

Fig. 4. Site-specific AUCs for osteoporosis prediction. External institution 4 (n = 38) is not shown because of the absence of positive cases.
Performance metrics
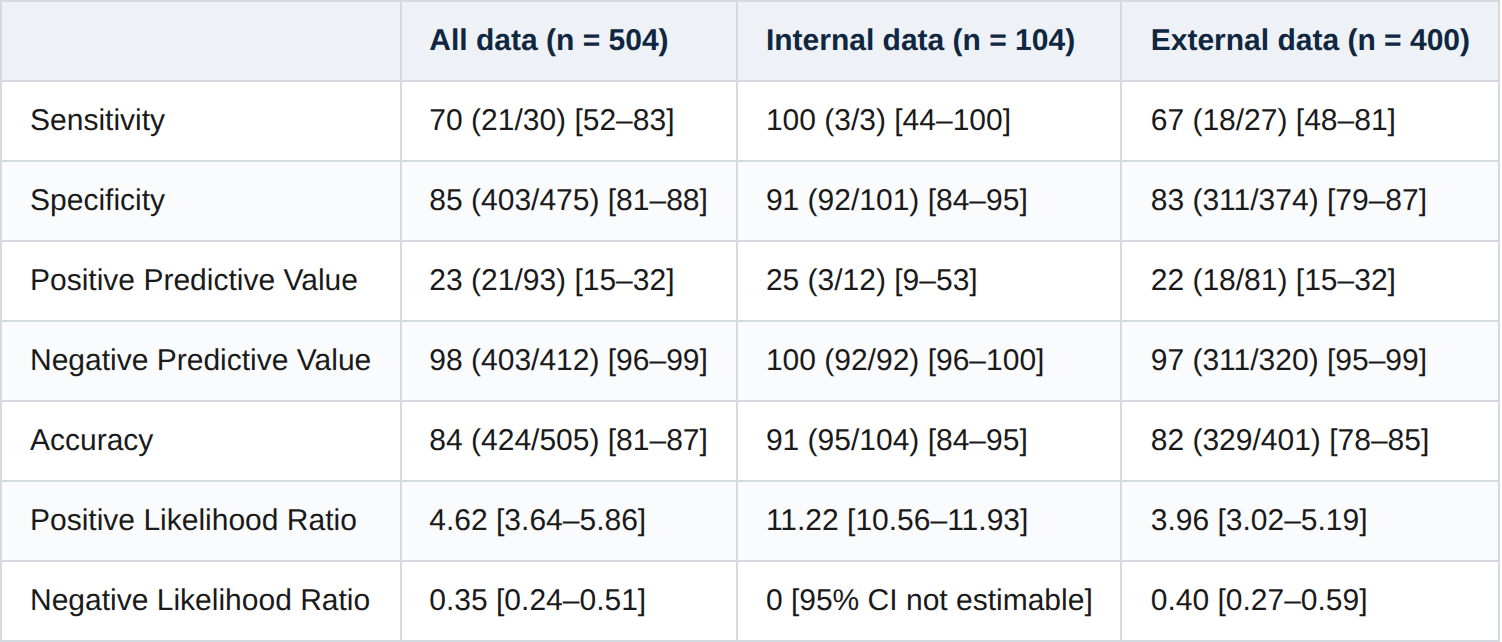
Optimal thresholds were also obtained using the Youden J method. The performance metrics derived from the threshold of 202.6 HU, obtained using the whole data, are detailed in Table 2. These metrics were also calculated using an internal-site derived threshold of 198 HU (Table 3).
Table 2. Performance metrics [95% CI] for predicting osteoporosis, considering a threshold of 203 HU.
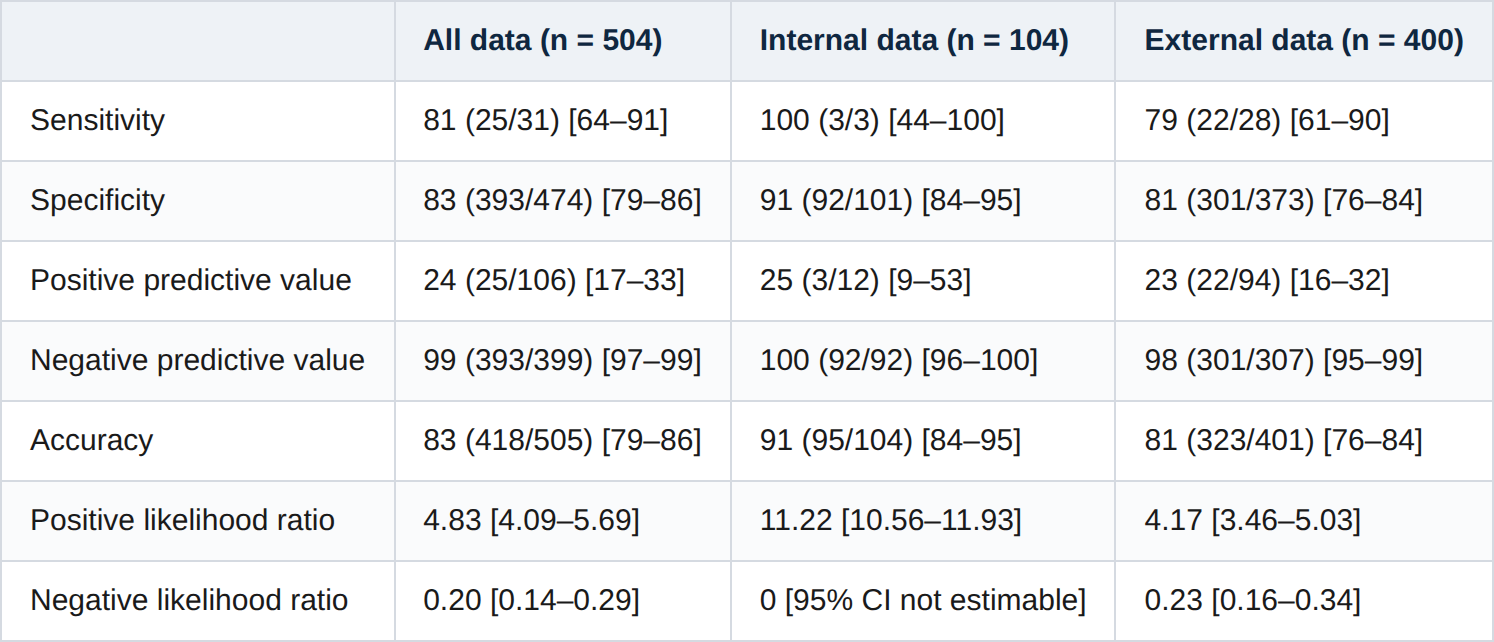
Table 3. Performance metrics [95% CI] for predicting osteoporosis, considering a threshold of 198 HU.
Precision–recall analysis further illustrated the performance of the MSMA model for osteoporosis detection (Fig. 5). Despite the modest precision values, reflecting the low prevalence of osteoporosis in the study population, recall (sensitivity) remained adequate across thresholds, consistent with the model's high negative predictive value.
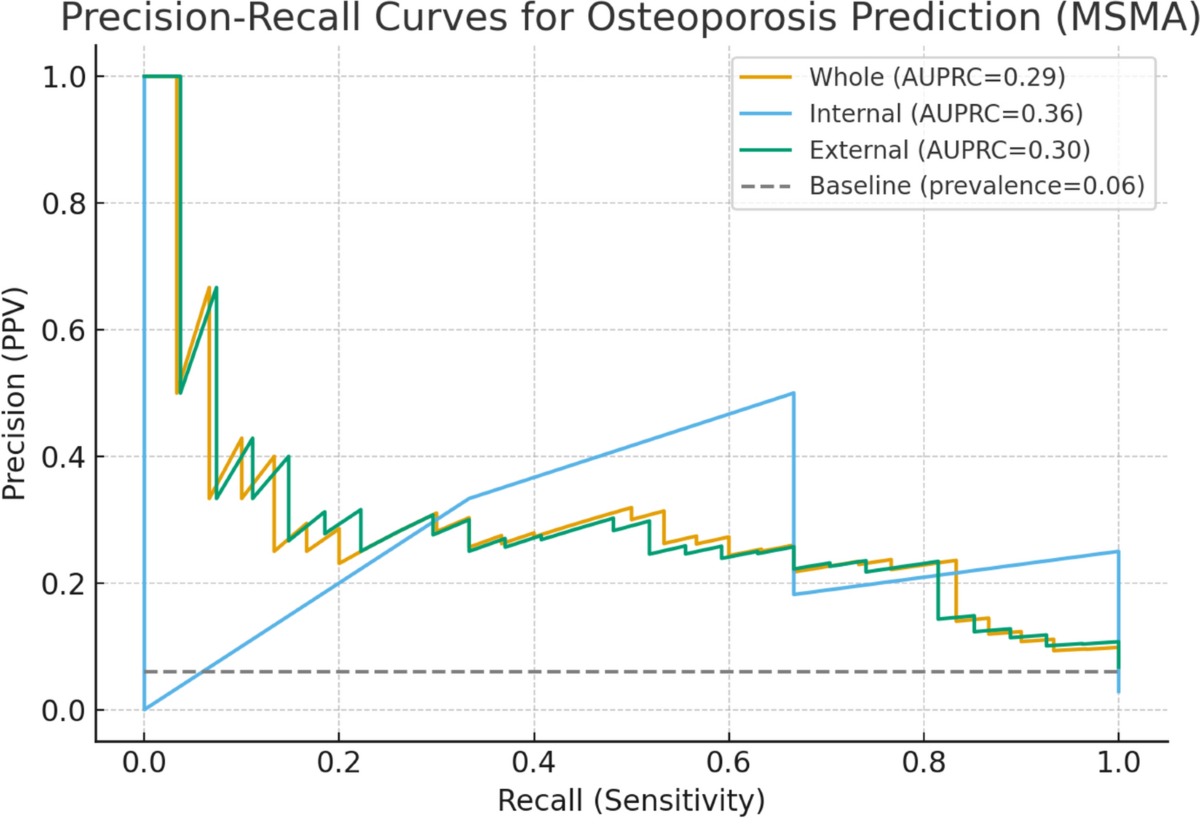
Fig. 5. Precision–recall curves. The dashed horizontal line represents the prevalence of osteoporosis in the study population (≈6%). The improvement of the model curves above this baseline illustrates added value compared with random classification.
Mixed-effects logistic regression
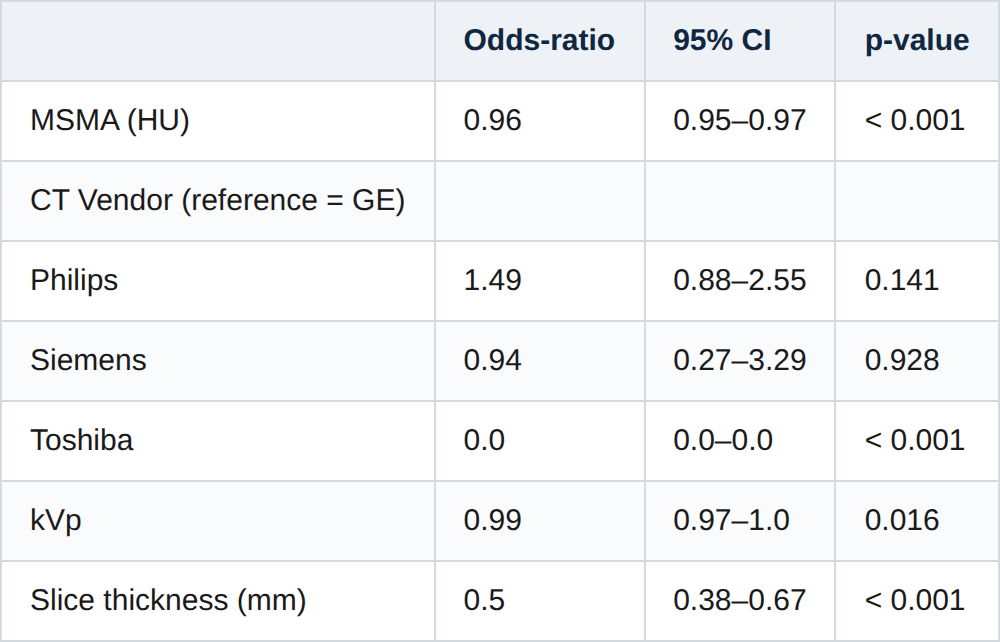
Mixed-effects logistic regression showed that lower MSMA values were significantly associated with higher odds of osteoporosis, independent of vendor, kVp, and slice thickness (p < 0.001). The effect size for MSMA remained robust after adjustment, with an odds ratio (OR) < 1 (Table 4).
Table 4. Mixed-effects logistic regression to evaluate whether MSMA was independently associated with the diagnosis of osteoporosis.
Calibration
The MSMA model also demonstrated good calibration between predicted probabilities and observed outcomes. The calibration plot showed small deviation from the reference line across most of the probability range (Supplemental figure 2). The Brier score was 0.054, indicating good agreement between predicted and actual outcomes (values closer to 0 reflect better calibration).
Discussion
General considerations
Our study examines the potential of using abdominal CT scans, a commonly performed imaging test, as an opportunistic screening tool for identifying individuals with LBMD, using a DL technique, enhanced by a multicenter validation. To our knowledge, ours is one of the few DL algorithms to be published in the literature that has done this step. The robustness of our algorithm across different patient orientations, including pronated positions, further reinforces its potential for clinical application in diverse settings. By testing our algorithm across a variety of patient populations, we have significantly enhanced the generalizability and credibility of our findings. Furthermore, our algorithm has shown to keep good performance in a dataset comprising multiple CT vendors and varying slice thickness. This suggests that it may work also in a variety of equipment settings.
The segmentation performance, as indicated by the Dice coefficient, was consistent in both the validation and hold-out test sets. This high level of precision is crucial, as vertebrae attenuation in routine CT scans has been shown to correlate well with BMD values derived from both Quantitative Computed Tomography and DEXA scans [12, 15]. However, we acknowledge this step comprised only 105 patients, resulting in a limited sample size. We also didn't include 3D segmentation techniques in our approach. As such, future research should evaluate 3D methods and larger training datasets to further improve precision.
This potential is bolstered by the Pearson correlation coefficient (r) value of 0.62 obtained between MSMA and BMD in our study, consistent with values reported in the literature comparing trabecular bone attenuation and DEXA-based BMD, which range from 0.399 to 0.891 [31], although through studies that utilized internal validation only. A recent single center study by Pickhard et al. [23], featuring another DL method, using a seven-slice median approach, with an ellipsis placed on the anterior aspect of the trabecular bone of L1, had an AUC of 0.93 with up to 94% sensitivity and 84% specificity for osteoporosis prediction, similar results to ours' internal validation performance. An advantage of using the whole lumbar spine is that fractures or other pathological processes that may affect L1 will interfere less with the results. Also, by including cortical bone in the segmentations, we take into account that fragility fractures are often a result of both cortical thinning and loss of trabecular bone [38–40].
While radiomics approaches for osteoporosis are increasingly recognized for their diagnostic performance [41–43], the strength of our study lies in demonstrating that a simple HU-based method retains significant diagnostic value in a multi-center setting. Despite the lower complexity of HU-based models, they offer key advantages: transparency, interpretability, and immediate feasibility in routine clinical workflows. These features make HU-based screening particularly attractive for broad adoption.
From a workflow perspective, a threshold of ~198 HU derived from the internal dataset identified most osteoporosis cases, but a threshold of ~203 HU derived from the entire dataset yielded even better results overall and might be better suited for clinical decision. Future work may require site-specific recalibration.
External performance drop considerations
There was a noted drop in performance during the external testing phase, however, it is important to acknowledge that, while our internal data derives from a private practice outpatient setting, three out of the four external testing institutions, UCSF, UAB and UHH are high-complexity healthcare facilities, which handle a lower proportion of normal or near-normal exams. This is a factor that can impact the performance of our MSMA model, as these patients with multiple comorbidities often present with greater anatomical variability, are more likely to have pathological bone alterations, and their scans might be of reduced image consistency owing to higher fat-to-muscle ratios and increased susceptibility to noise and artifacts.
Differences in vendor profiles between the internal and external datasets may also have contributed to the external performance drop. However, there are some mitigation strategies, including phantom-based calibration techniques or vendor-specific calibration, that may help address inter-scanner variability in future research.
Limitations
The segmentation model was trained on a convenience sample of 105 cases, and demographic data were not available. While this may limit evaluation of its representativeness, segmentation was used solely as a preprocessing step, and the model's utility was supported by the external validation of CT-derived attenuation values against DEXA.
Our validation cohort showed a relatively low prevalence of positive cases, although the osteoporosis values were not markedly different from those reported in postmenopausal women in the NHANES cohort (2005–2018) [44]. This resulted in low PPVs, while NPVs remained high. Clinically, this pattern suggests that the algorithm is best suited as a triage or flagging tool—helping to reliably rule out normal patients and prioritize those who may require confirmatory DEXA. It is important to emphasize that, although overall PPVs were low, 73.6% of individuals with attenuation values below 203 HU had at least osteopenia (T-score < −1) and may still benefit from preventive or therapeutic interventions. In addition, the PRAUC curves demonstrated precision values well above the baseline prevalence of osteoporosis, underscoring the clinical relevance of the model.
We also utilized BMD values obtained from DEXA scans as our primary reference standard. However, it's vital to acknowledge that other reference standards, particularly those based on adverse outcomes like fractures or injurious falls, are also critical. We aim to explore these additional endpoints in our forthcoming research. Another limitation of our study is the employment of a methodology that is not as extensively validated in scientific literature compared to the ellipsis method, and is more challenging to benchmark against manual measurements. Notably, these manual measurements were not incorporated into our analysis. A less critical yet noteworthy limitation of our study is the validation of our algorithm exclusively on non-contrast enhanced scans. This focus may restrict its applicability in certain healthcare settings where scanning protocols exclusively include contrast phases, potentially limiting its broader adoption.
Conclusion
In conclusion, our study advances the field of osteoporosis screening by demonstrating the feasibility and effectiveness of using DL algorithms with abdominal CT scans. The multicenter nature of our validation provides a foundation for future research and potential clinical application. As validation studies continue to evolve, it is anticipated that such opportunistic screening methods will become increasingly integrated into routine clinical practice, aiding in the early detection and management of osteoporosis.