Artificial Intelligence Class Activation Mapping of Bone Age

Summary
Online supplemental material is available for this article.
Online supplemental material is available for this article.
Interpretation of bone age is a common request for radiologists who handle referrals from pediatric endocrinologists. Typically, the interpretation of bone age depends on the comparison of the hand radiograph in question to a standard atlas derived from normal male and female development.
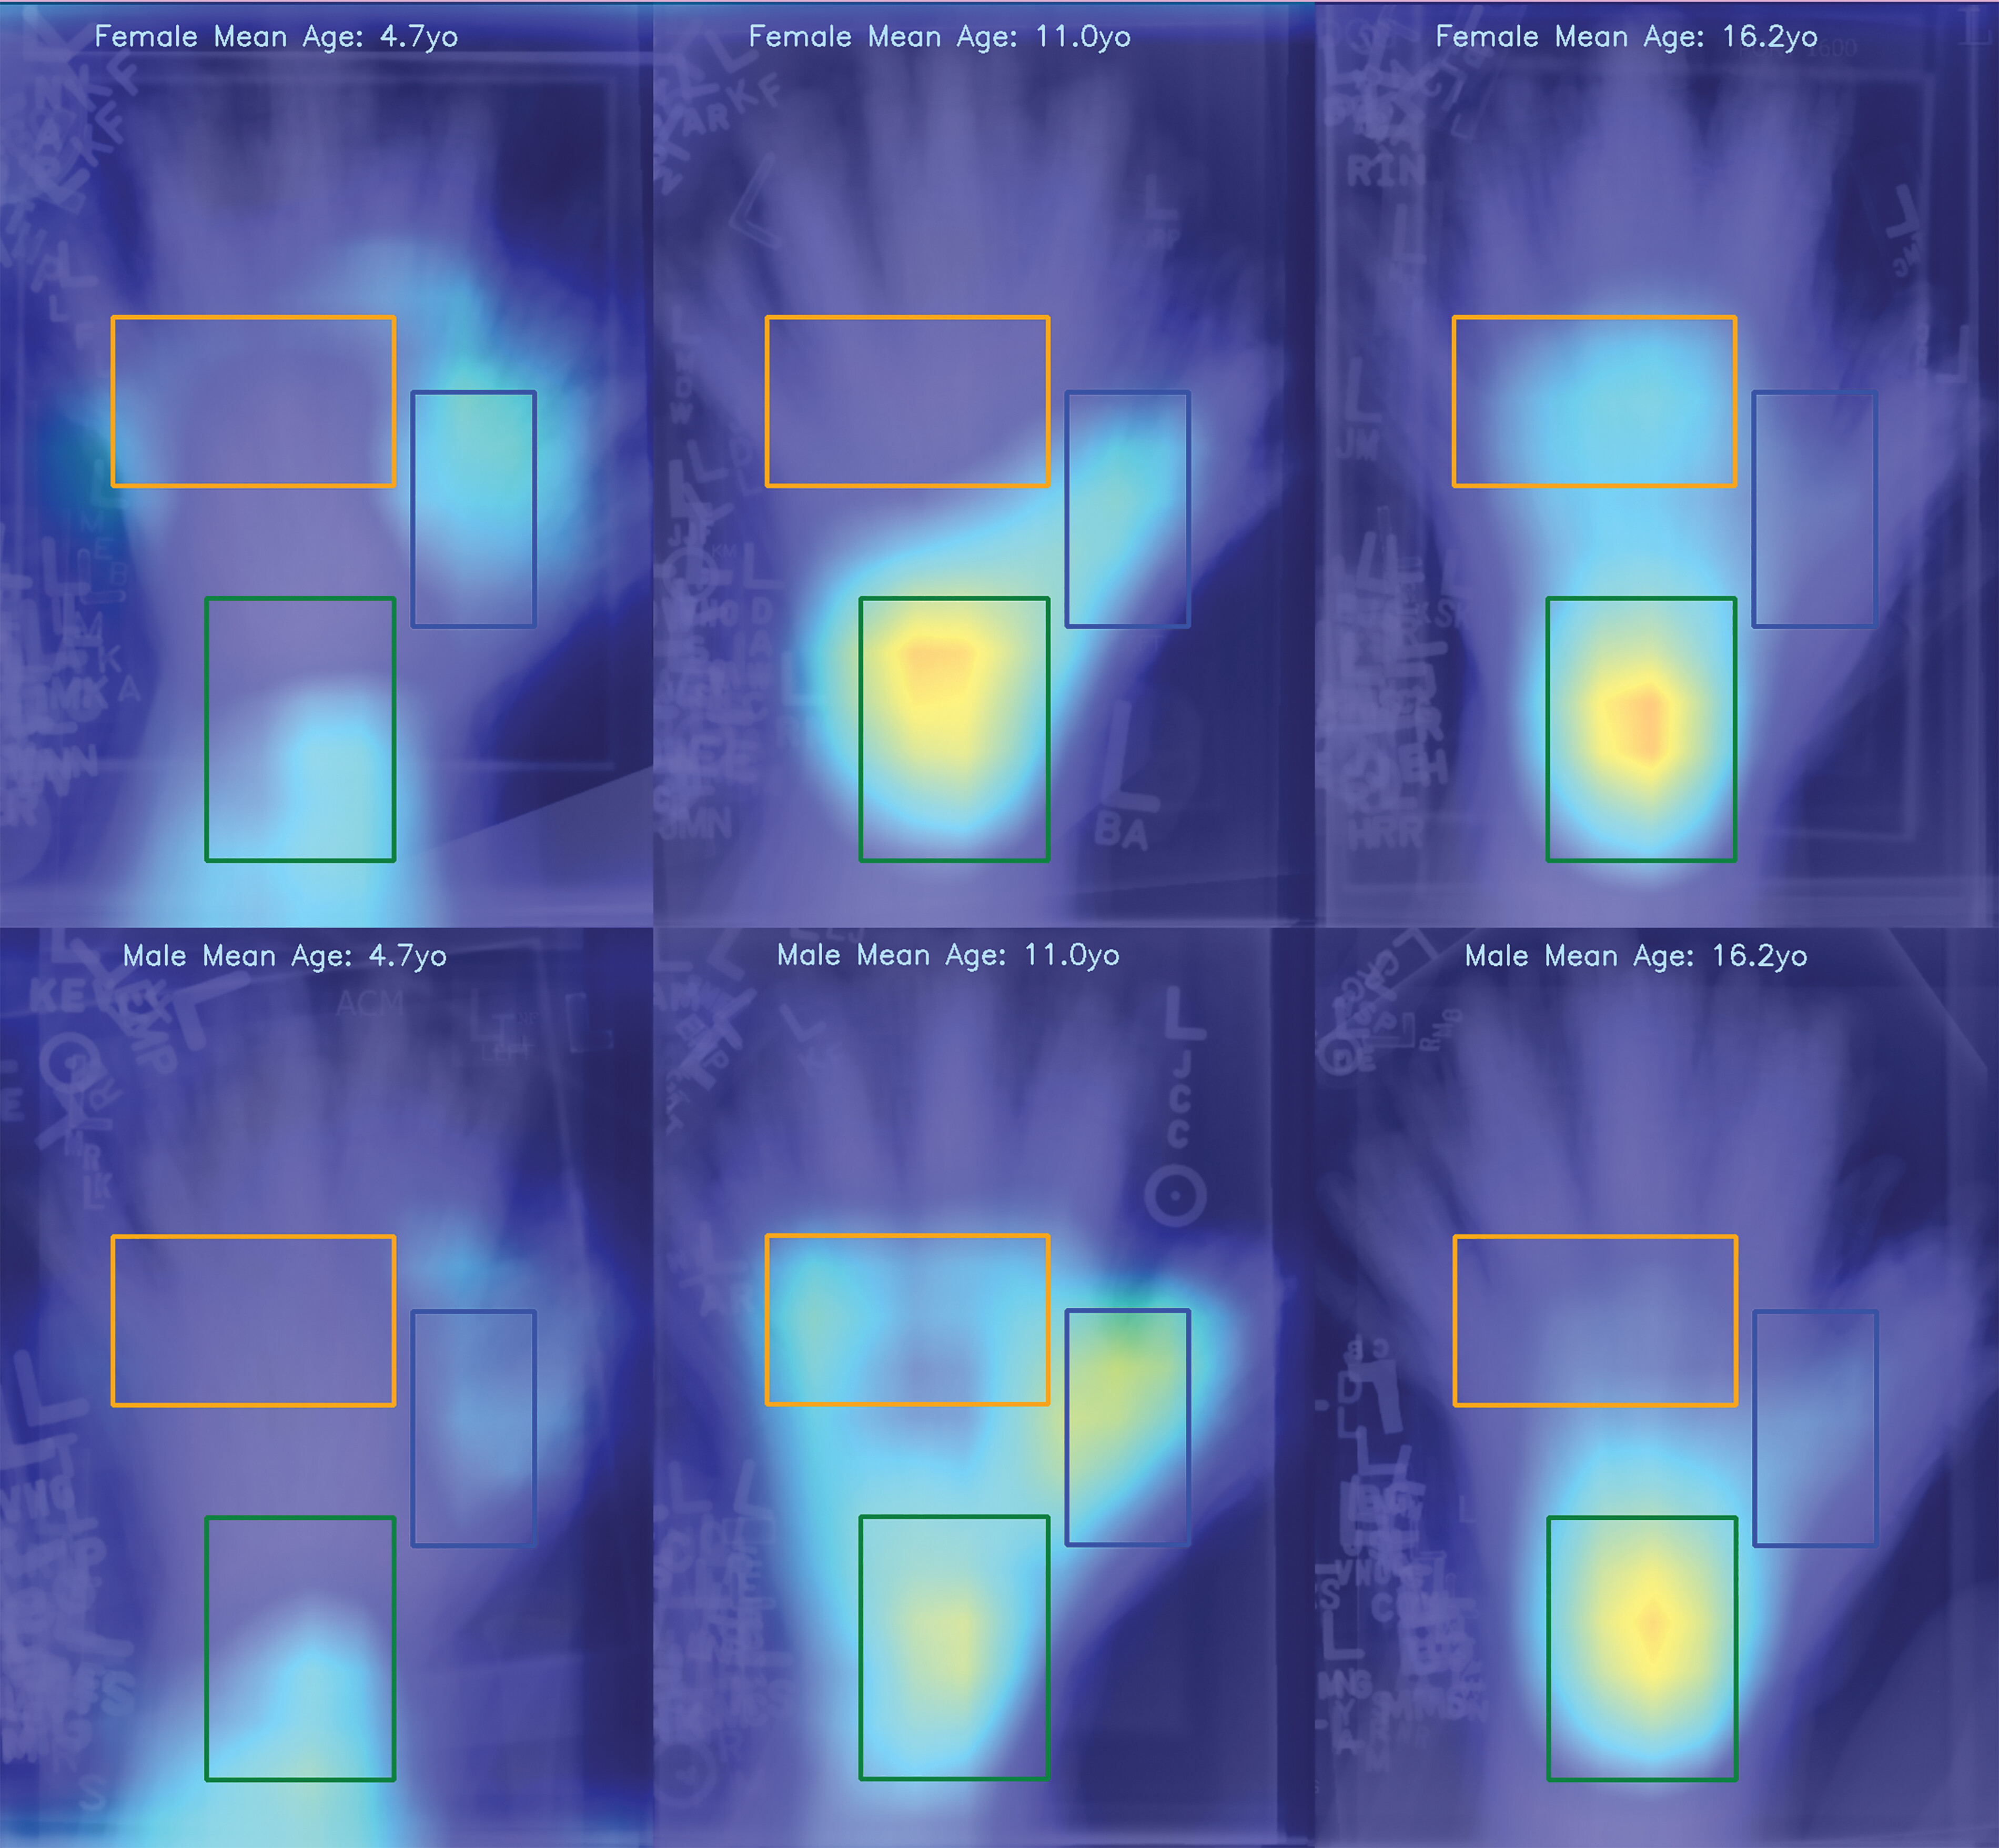
The use of artificial intelligence has recently been applied to the interpretation of bone age. Gradient-weighted class activation mapping has been widely used to interpret predictions of deep learning models in computer vision by producing activation maps that attempt to highlight the region most relevant to the model’s prediction 1,2. We showed the moving average of activation maps from multiple bone age radiographs to improve the depiction of anatomic regions, which the model consistently uses as predictors of bone age, while reducing spurious associations in the activation maps ( Figure ; ( Appendix E1 , ( Movie [both online]).
Three anatomic regions (carpus, thumb, and metacarpophalangeal joint) and the mean intensities of the activation maps in those regions were plotted against age to demonstrate the variability of the importance of that area to predict bone age for all age ranges ( Fig E1 [online]). The graph shown in Figure E1 (online) can be used to illustrate differences in growth patterns between specific ethnic groups, for example.