Performance of Algorithms Submitted in the 2023 RSNA Screening Mammography Breast Cancer Detection AI Challenge

Summary
Background The 2023 RSNA Screening Mammography Breast Cancer Detection AI Challenge invited participants to develop artificial intelligence (AI) models capable of independently interpreting mammograms. Purpose To assess the performance of the submitted algorithms, explore the potential for improving performance by combining the best-performing AI algorithms, and investigate how performance was influenced by the demographic and clinical characteristics of the evaluation cohort. Materials and Methods A total of 1687 AI algorithms were submitted from November 2022 to February 2023. Of these, 1537 algorithms were assessed using an evaluation dataset from two sites—one in the United States and one in Australia. Cancer cases were identified at screening and confirmed with pathologic examination; noncancer cases were followed up for at least 1 year. Results for ensemble models of top algorithms were computed by recalling a case when any of the included algorithms indicated recall. Odds ratios (ORs) were used to investigate differences in AI performance when the dataset was stratified by clinical or demographic characteristics. Results The evaluation dataset consisted of 5415 women (median age, 59 years [IQR, 52–66 years]). Among the 1537 AI algorithms, the median recall rate, sensitivity, specificity, and positive predictive value (PPV) were 1.7%, 27.6%, 98.7%, and 36.9%, respectively. For the top-ranked algorithm, the recall rate, sensitivity, specificity, and PPV were 1.5%, 48.6%, 99.5%, and 64.6%, respectively. Ensemble models of the top 3 and top 10 algorithms had a sensitivity of 60.7% and 67.8%, respectively; the corresponding recall rates were 2.4% and 3.5%, and the corresponding specificities were 98.8% and 97.8%. Lower sensitivity was observed for the U.S. dataset than for the Australian dataset (top 3 ensemble model: 52.0% vs 68.1%; OR = 0.51; P = .02), and greater sensitivity was observed for invasive cancers than for noninvasive cancers (top 3 ensemble model: 68.0% vs 43.8%; OR = 2.73; P = .001). Conclusion The different AI algorithms identified different cancers during screening mammography, and ensemble models had increased sensitivity while maintaining low recall rates. © RSNA, 2025 Supplemental material is available for this article.
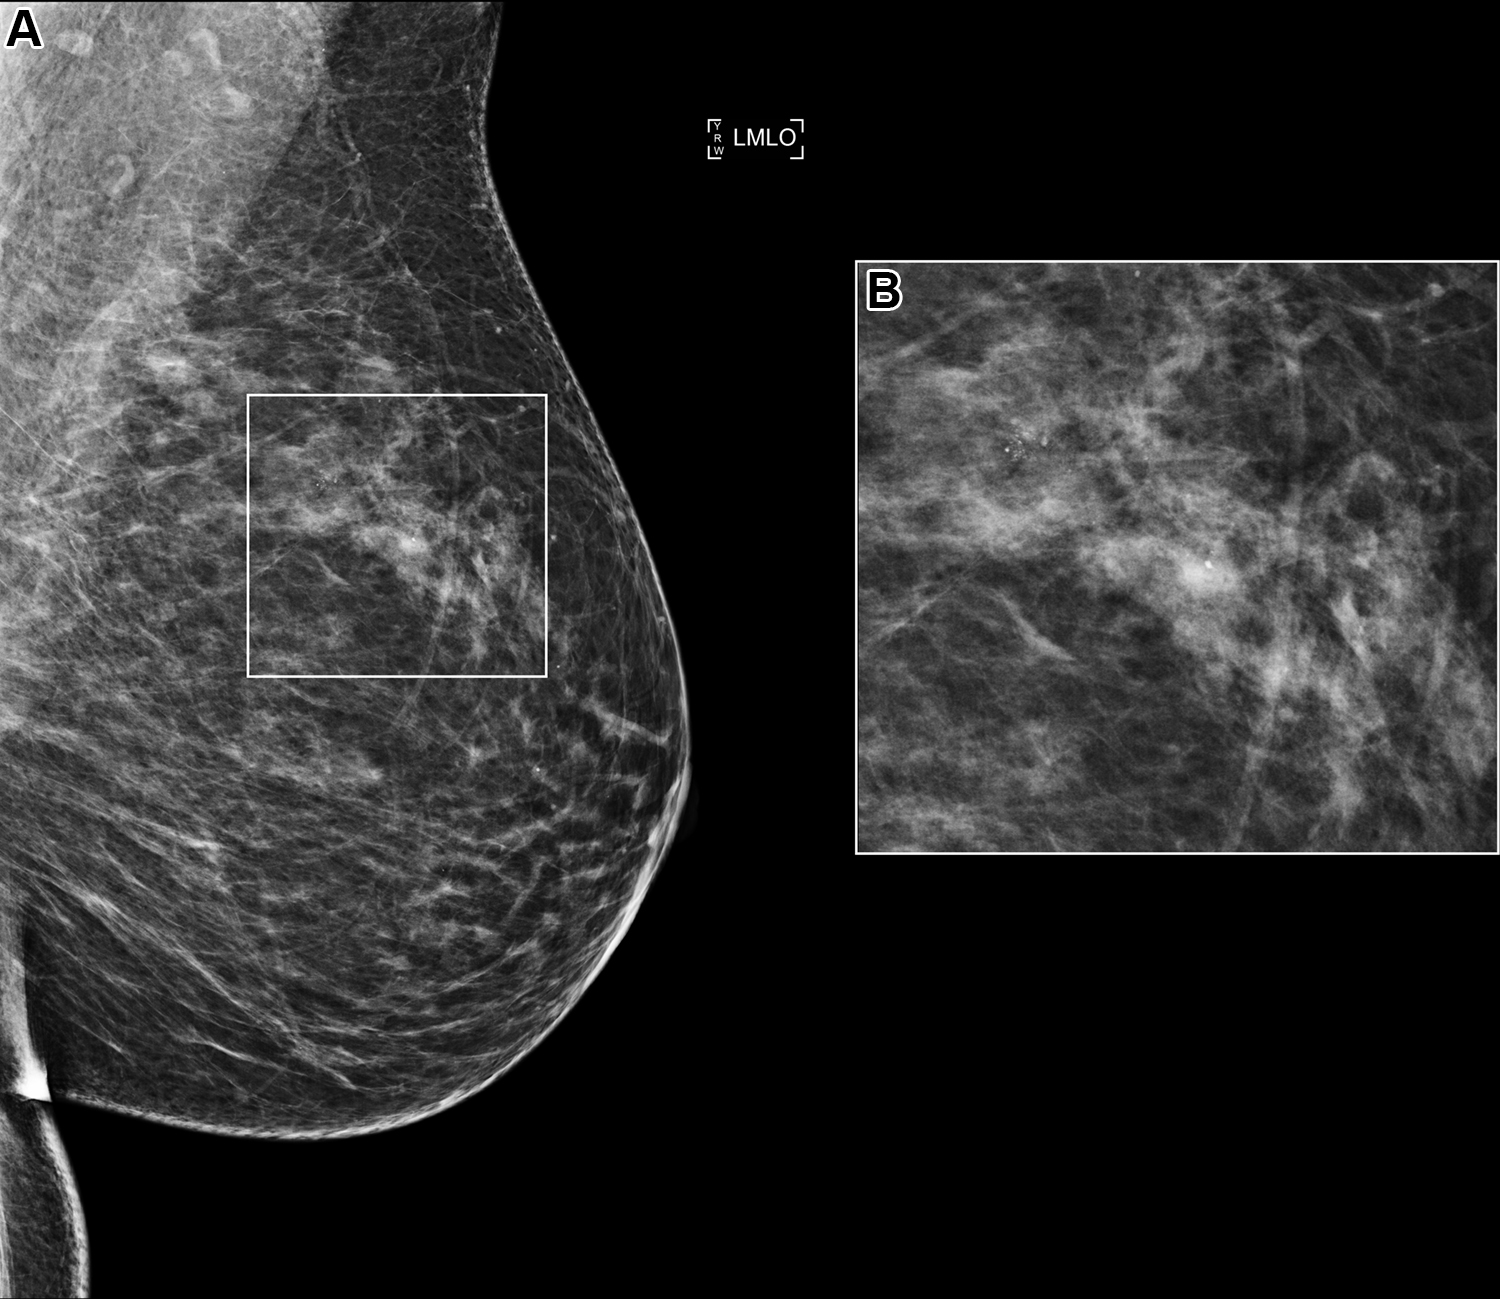
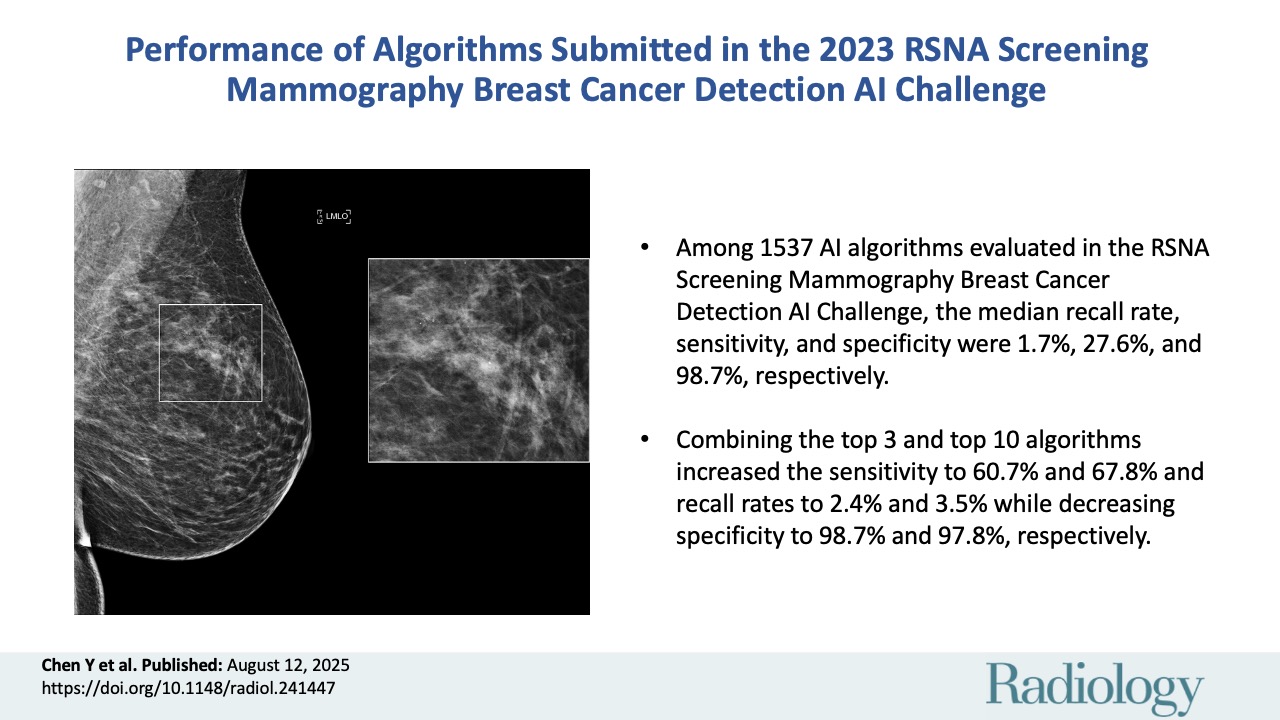
Figure 1: (A) Left mediolateral oblique (LMLO) mammogram in a 58-year-old woman with an area of microcalcification (box). (B) Magnified view (2.2×) of the box in A . This case was recalled by all of the top 10 artificial intelligence algorithms but was found to be benign at biopsy analysis. This example from the evaluation dataset is from the U.S. site and was acquired using Hologic equipment.
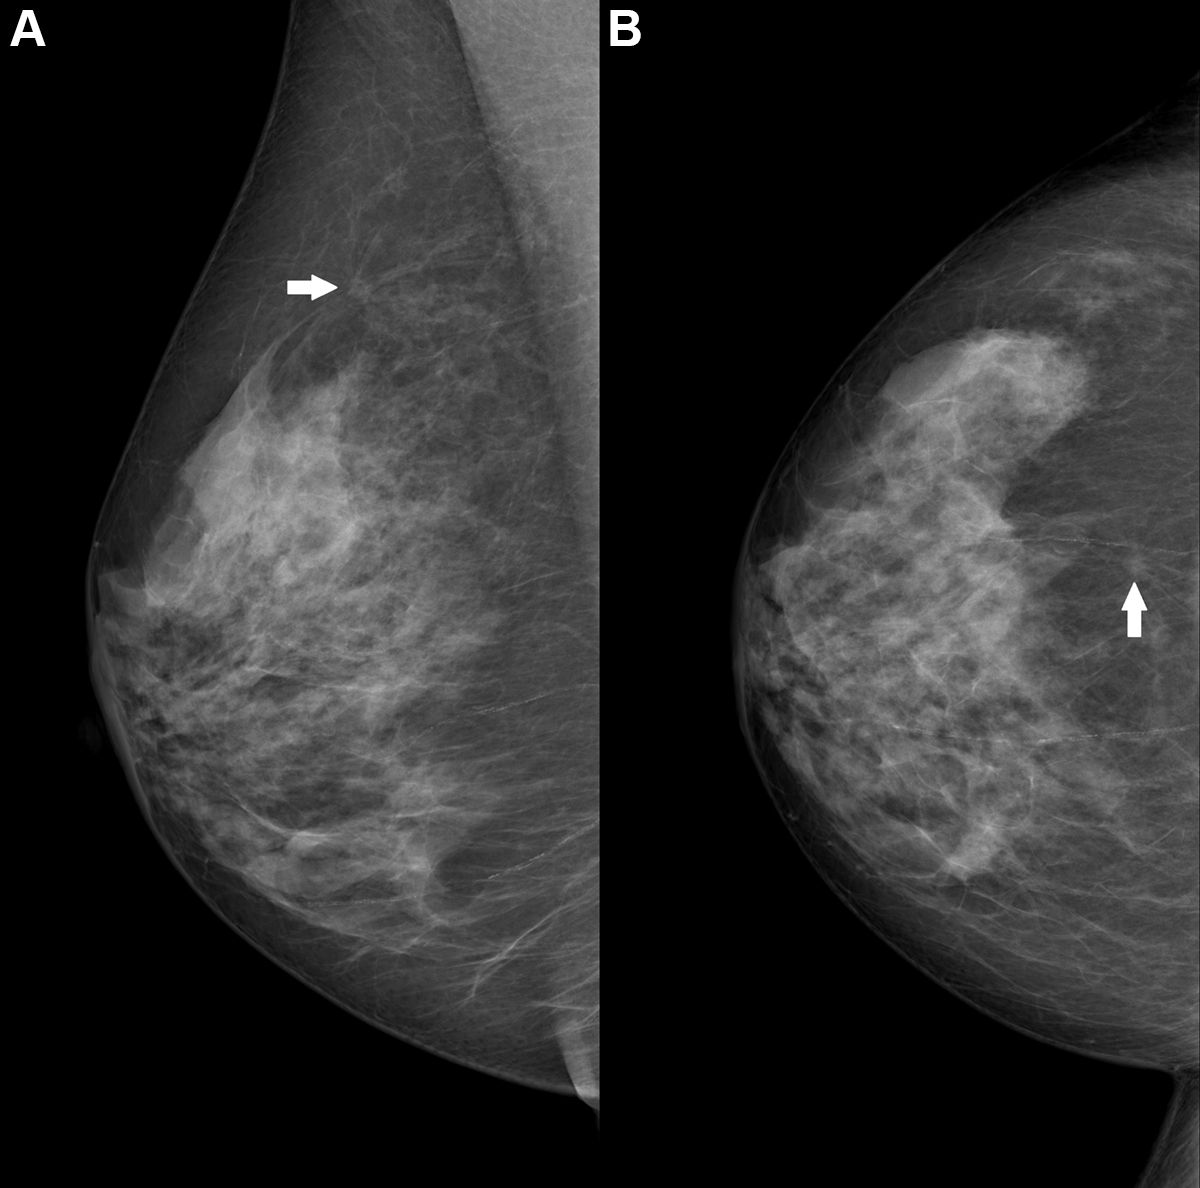
Figure 2: Right breast mammogram in a 69-year-old woman. There is a 6-mm spiculate mass in the 12 o'clock position (arrow), visible on both the (A) mediolateral oblique and (B) craniocaudal views. This case was not recalled by any of the top 10 artificial intelligence algorithms but was a biopsy-proven invasive carcinoma. This example from the evaluation dataset is from the Australian site and was acquired using Siemens Healthineers equipment.
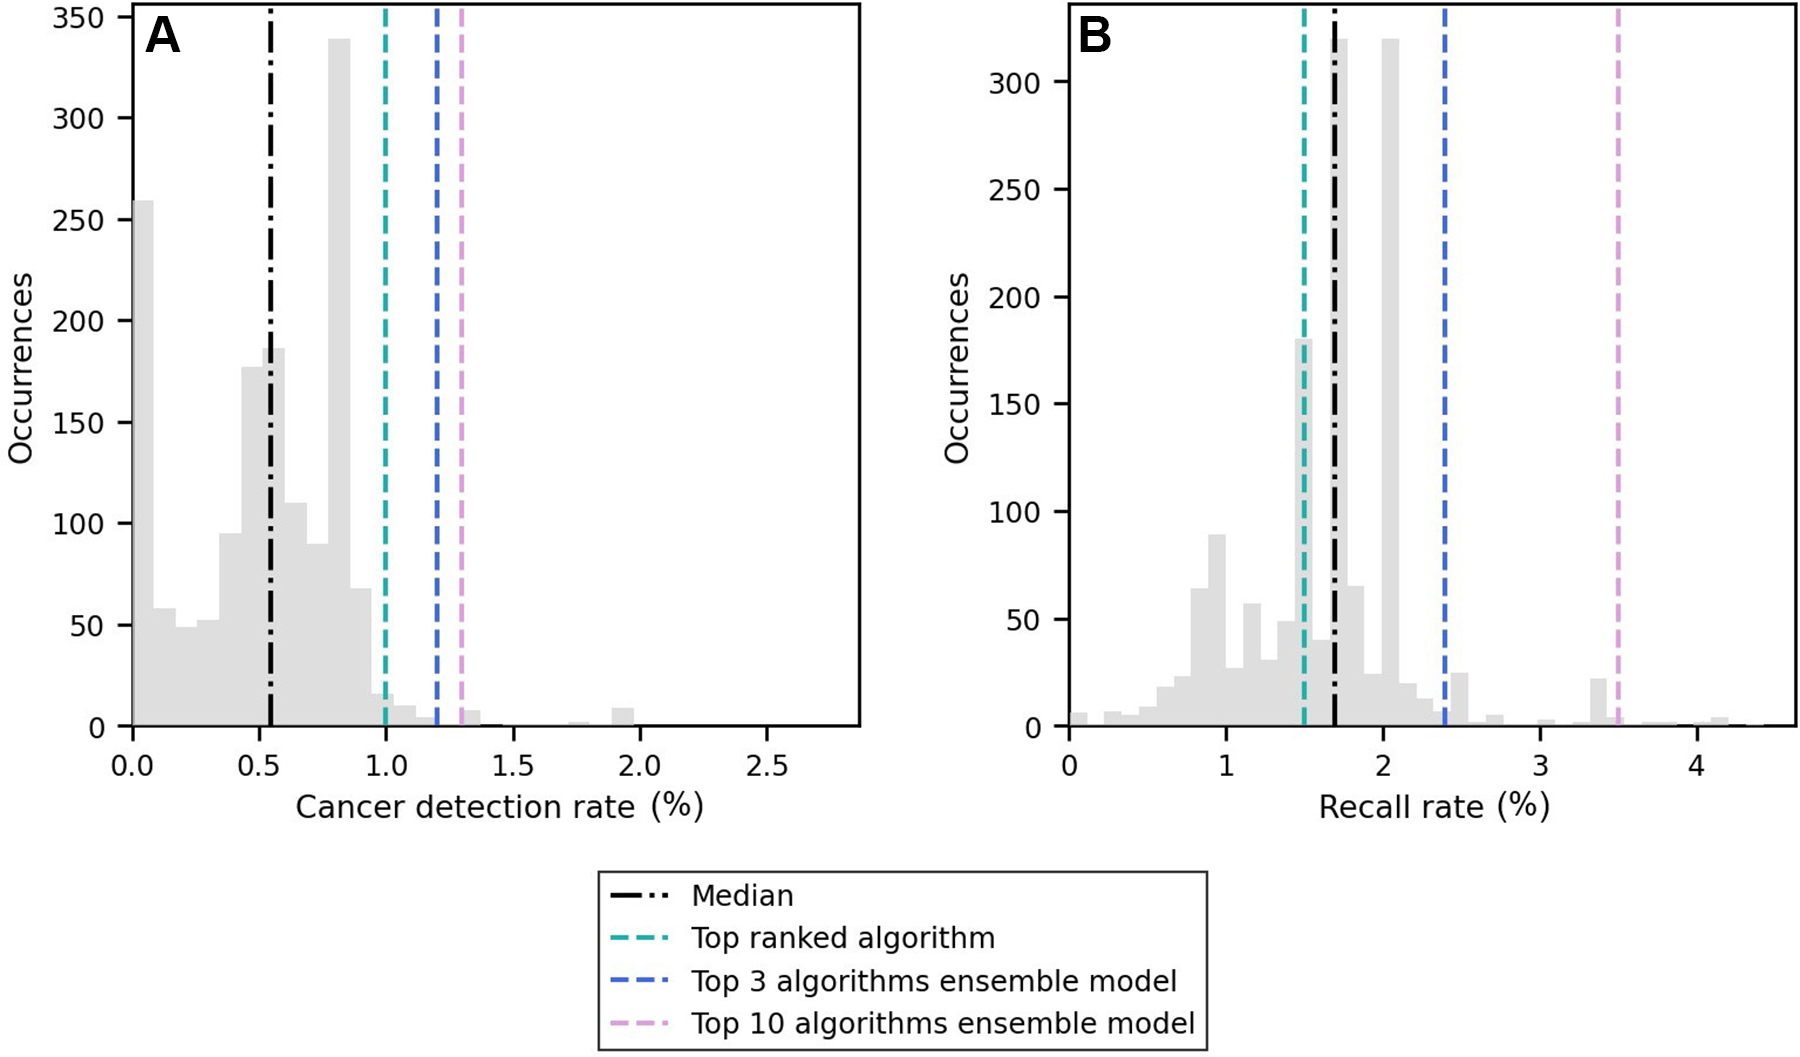
Figure 3: Distribution of (A) cancer detection rate and (B) recall rate among the 1537 artificial intelligence algorithms evaluated in this study (gray bars). The median value is represented by the black line, and the scores of the top-ranked algorithm and the two ensemble models are shown with colored lines.
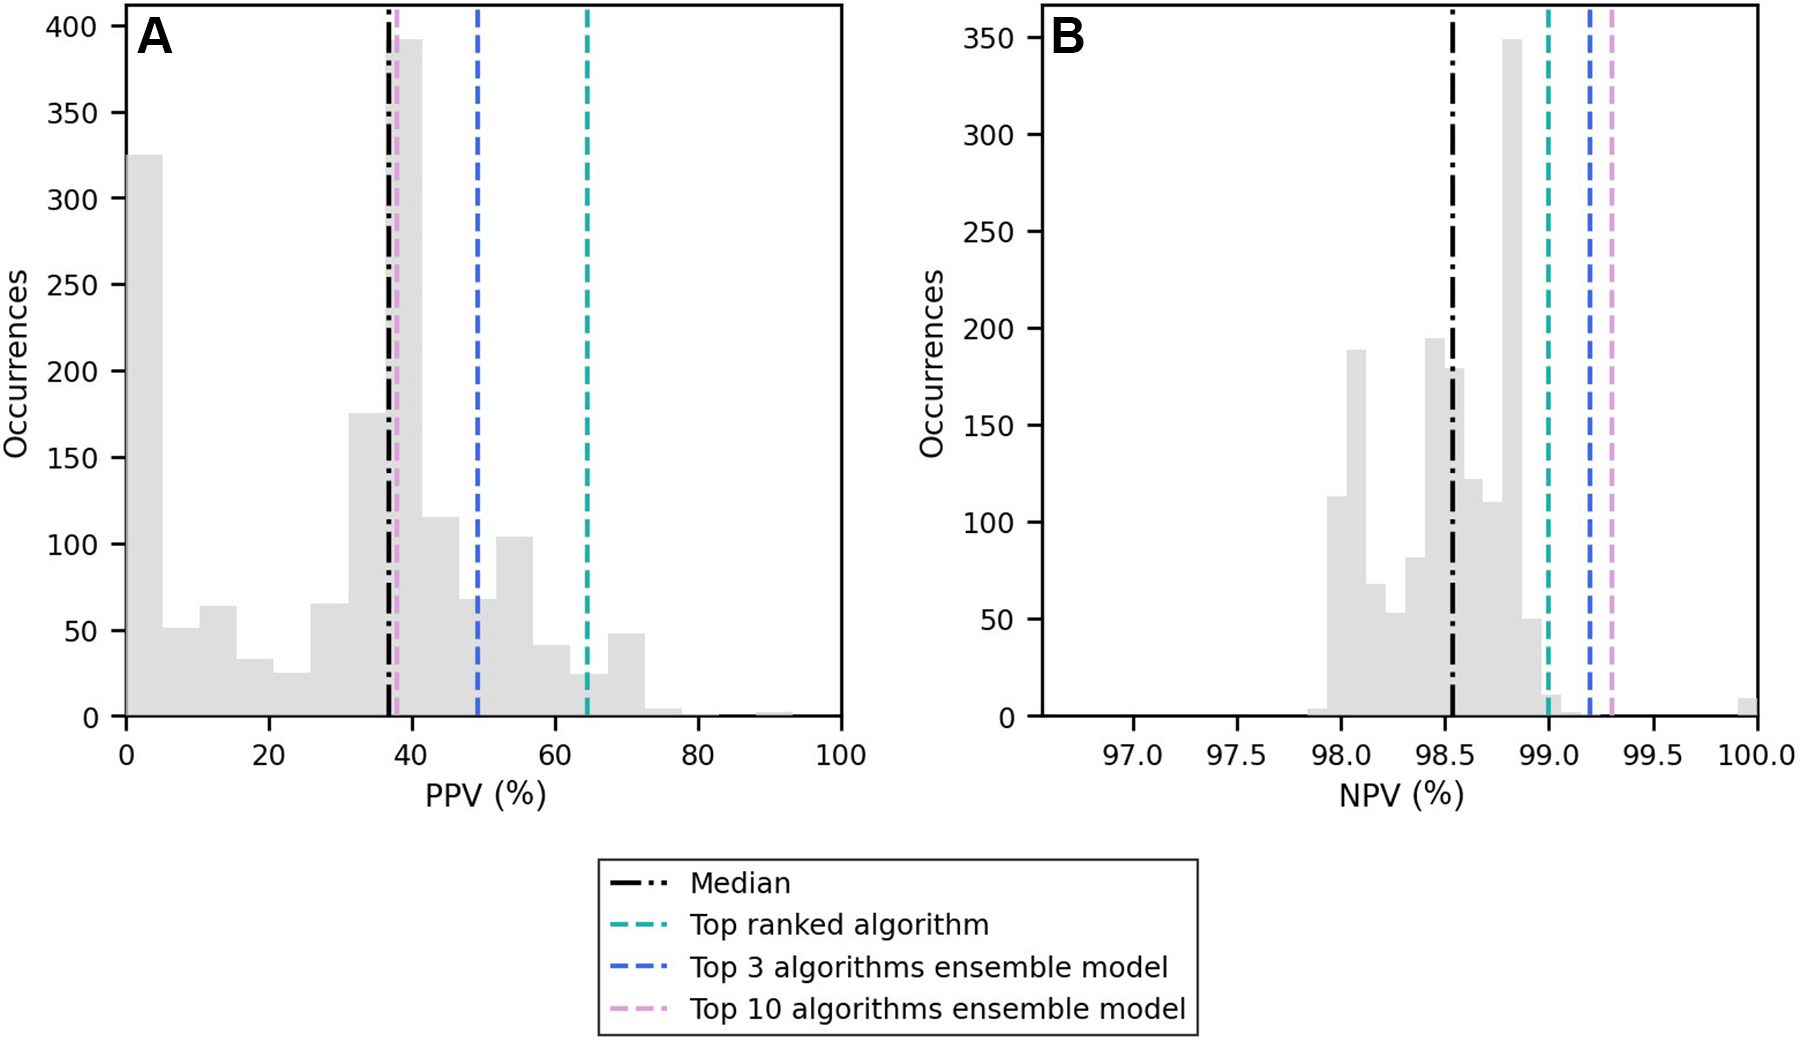
Figure 4: Distribution of (A) positive predictive value (PPV) and (B) negative predictive value (NPV) among the 1537 artificial intelligence algorithms evaluated in this study (gray bars). The median value is represented by the black line, and the scores of the top-ranked algorithm and the two ensemble models are shown with colored lines.
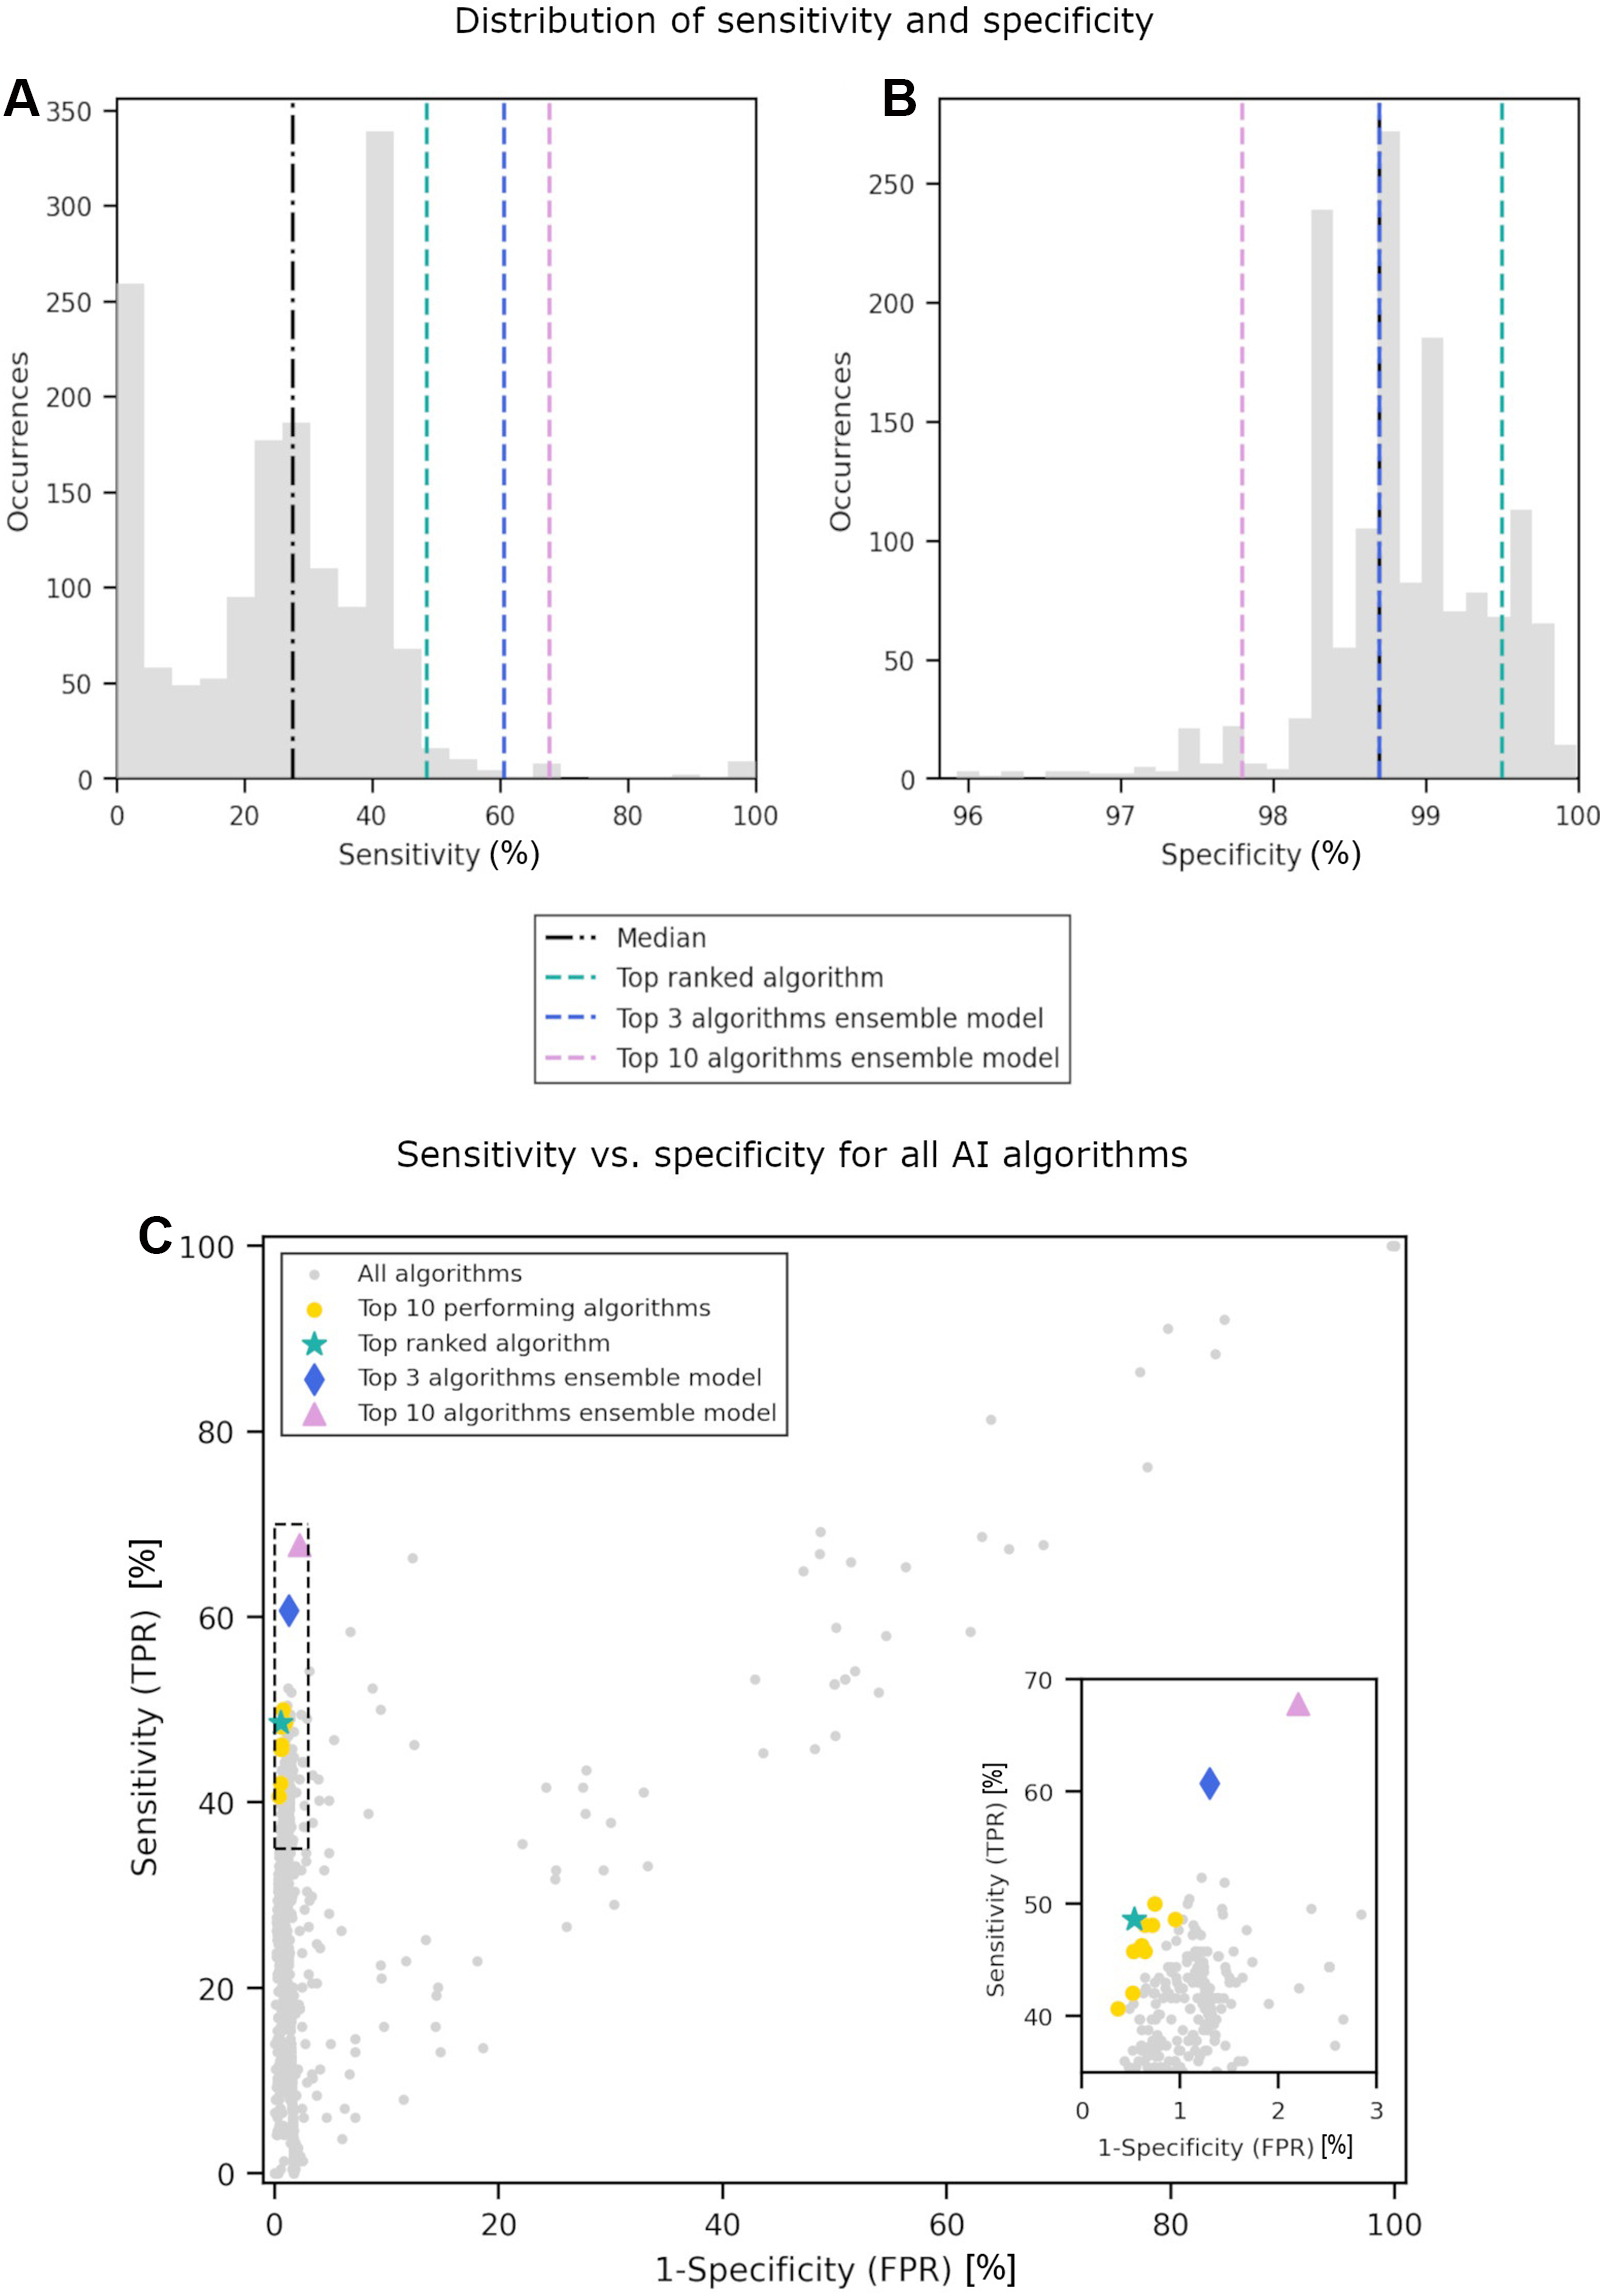
Figure 5: Distribution of (A) sensitivity and (B) specificity among the 1537 artificial intelligence (AI) algorithms evaluated in this study (gray bars). The median value is represented by the black line, and the scores of the top-ranked algorithm and the two ensemble models are shown with colored lines. (C) Scatterplot of sensitivity versus specificity for each AI algorithm, where each gray dot represents a single AI algorithm. The inset on the right provides an expanded view of the area in the dashed box, so that the distribution of the top-performing algorithms can be seen at greater resolution. FPR = false-positive rate, TPR = true-positive rate.
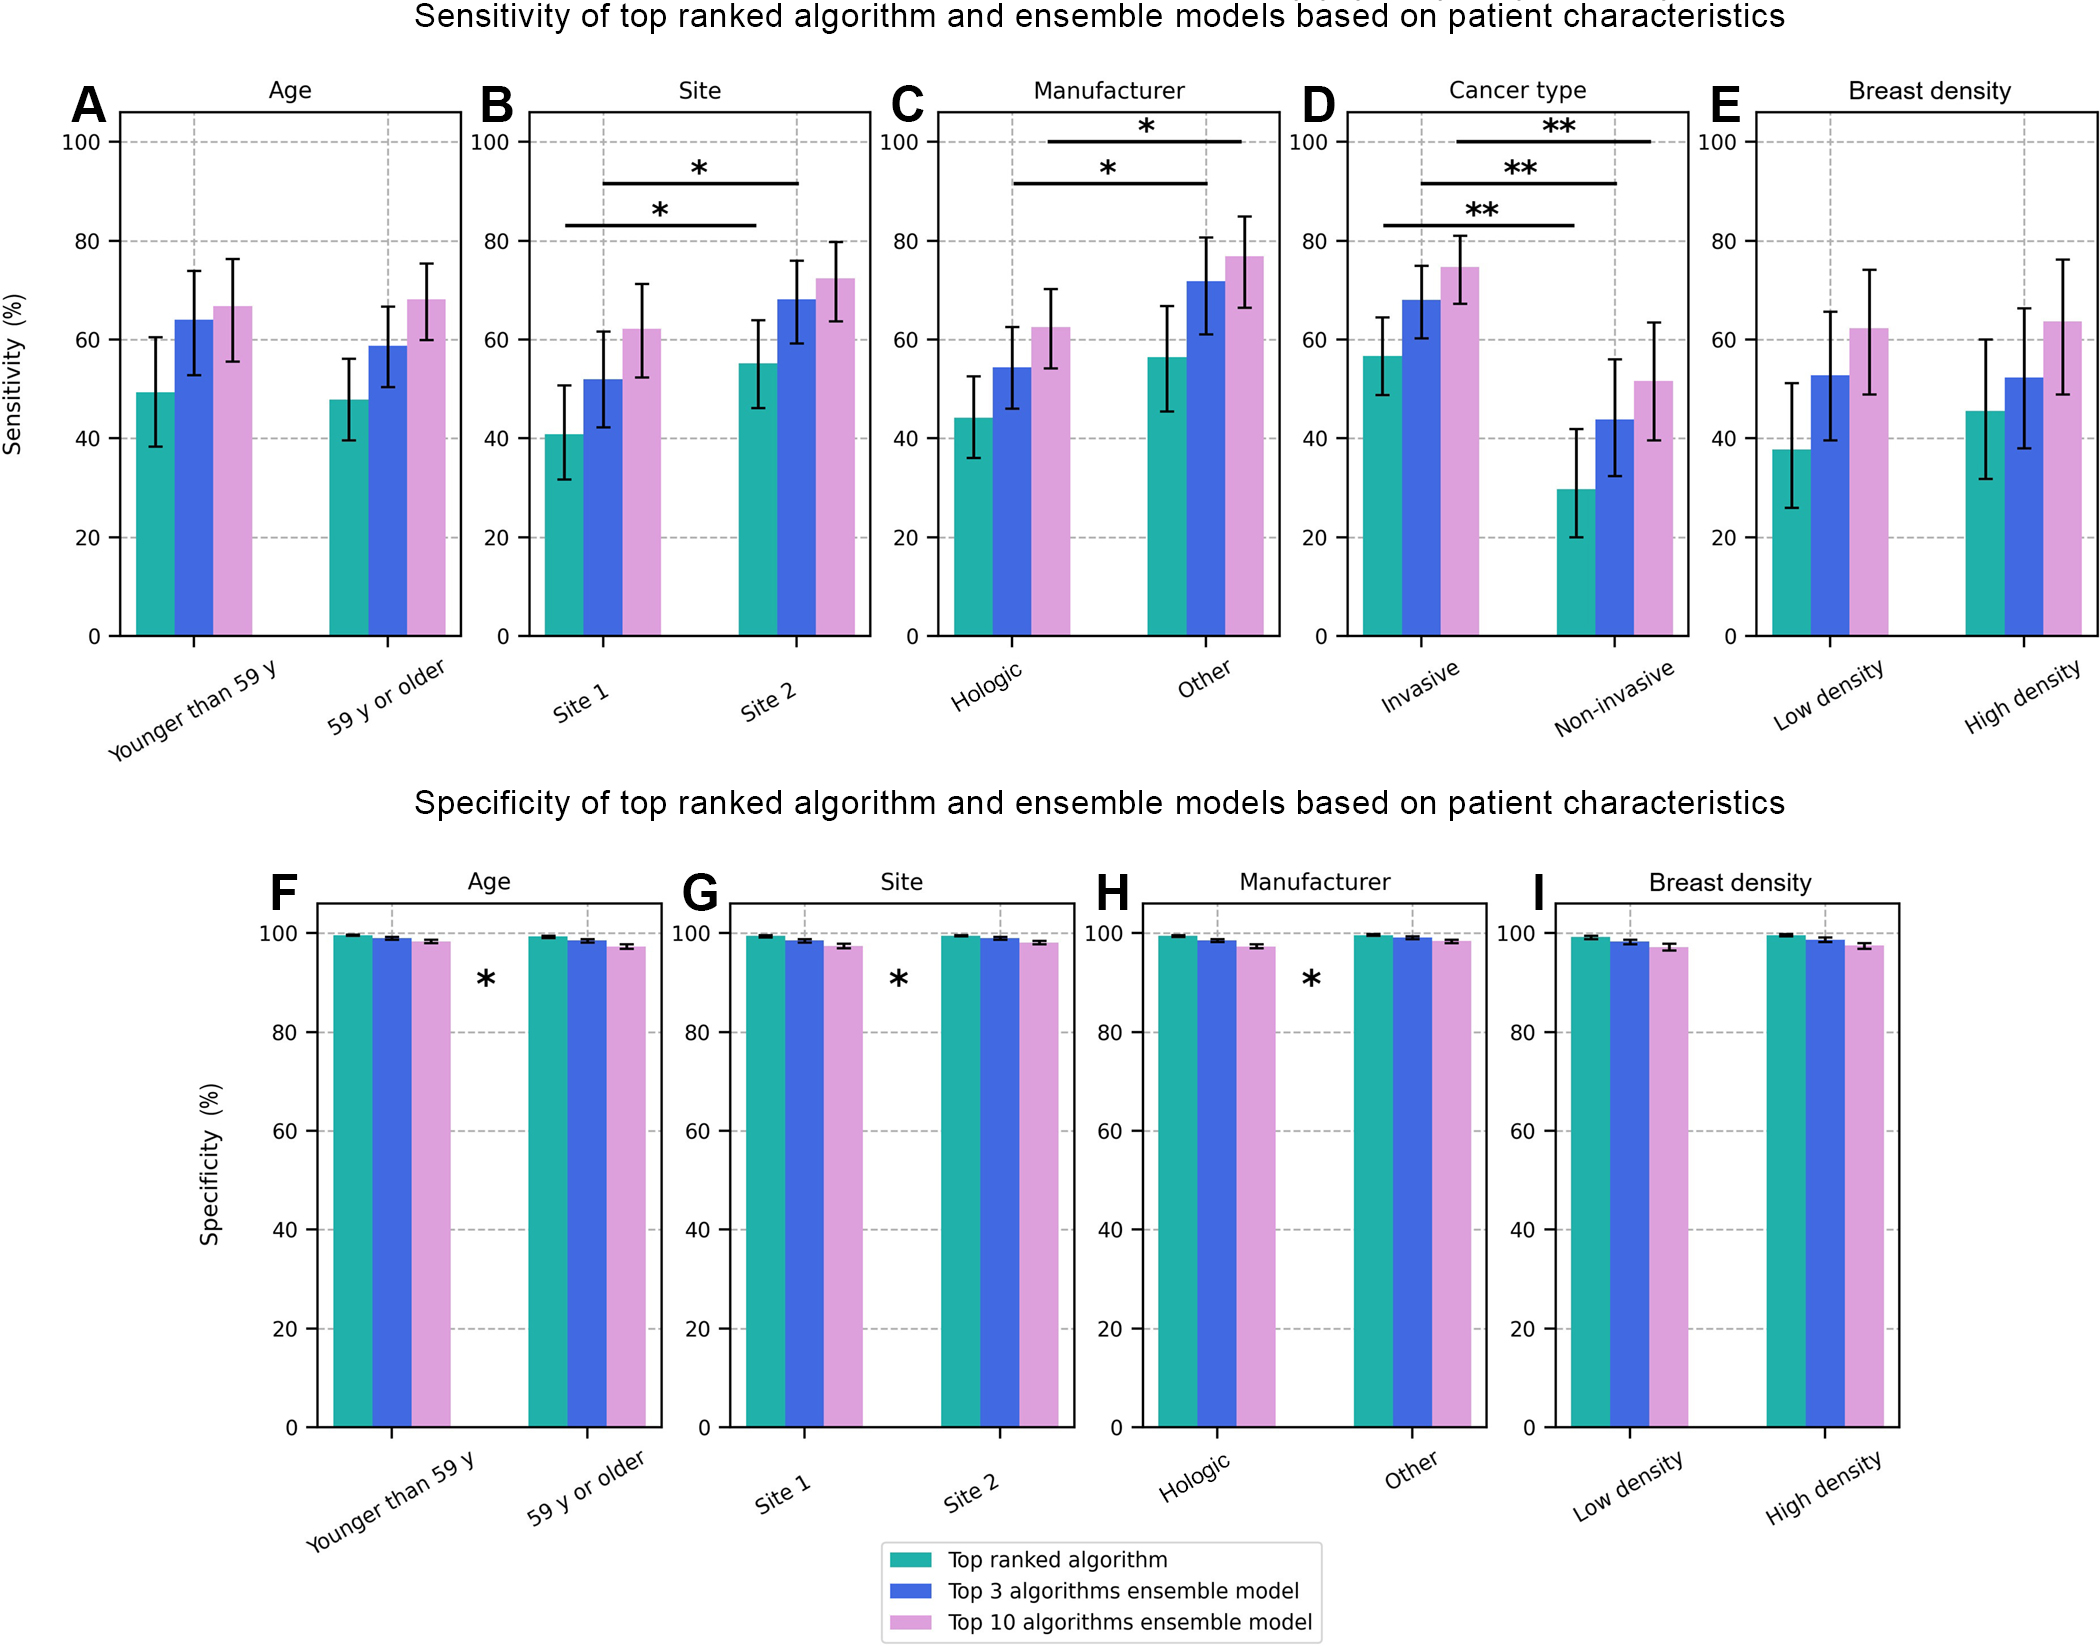
Figure 6: Bar plots showing the (A–E) sensitivity and (F–I) specificity of cancer detection by the top-performing artificial intelligence (AI) algorithm and the top 3 and top 10 ensemble models when the dataset was stratified as a function of different patient characteristics: (A, F) age, (B, G) site 1 (United States) versus site 2 (Australia), (C, H) equipment manufacturer (Hologic vs other [GE HealthCare, Fujifilm, Philips, or Siemens Healthineers]), (D) invasive versus noninvasive cancer, and (E, I) low-density breasts (Breast Imaging Reporting and Data System A or B) versus high-density breasts (Breast Imaging Reporting and Data System C or D). For the sensitivity plots, significant differences between subgroups are indicated: * = P < .05, ** = P < .005. Significant differences between subgroups are not indicated for specificity plots because of the relatively small differences in magnitude, but * indicates characteristics for which there was a significant difference between subgroups for one or more of the AI entities.