The RSNA Pediatric Bone Age Machine Learning Challenge
Summary
Purpose The Radiological Society of North America (RSNA) Pediatric Bone Age Machine Learning Challenge was created to show an application of machine learning (ML) and artificial intelligence (AI) in medical imaging, promote collaboration to catalyze AI model creation, and identify innovators in medical imaging. Materials and Methods The goal of this challenge was to solicit individuals and teams to create an algorithm or model using ML techniques that would accurately determine skeletal age in a curated data set of pediatric hand radiographs. The primary evaluation measure was the mean absolute distance (MAD) in months, which was calculated as the mean of the absolute values of the difference between the model estimates and those of the reference standard, bone age. Results A data set consisting of 14 236 hand radiographs (12 611 training set, 1425 validation set, 200 test set) was made available to registered challenge participants. A total of 260 individuals or teams registered on the Challenge website. A total of 105 submissions were uploaded from 48 unique users during the training, validation, and test phases. Almost all methods used deep neural network techniques based on one or more convolutional neural networks (CNNs). The best five results based on MAD were 4.2, 4.4, 4.4, 4.5, and 4.5 months, respectively. Conclusion The RSNA Pediatric Bone Age Machine Learning Challenge showed how a coordinated approach to solving a medical imaging problem can be successfully conducted. Future ML challenges will catalyze collaboration and development of ML tools and methods that can potentially improve diagnostic accuracy and patient care. © RSNA, 2018 Online supplemental material is available for this article. See also the editorial by Siegel in this issue.
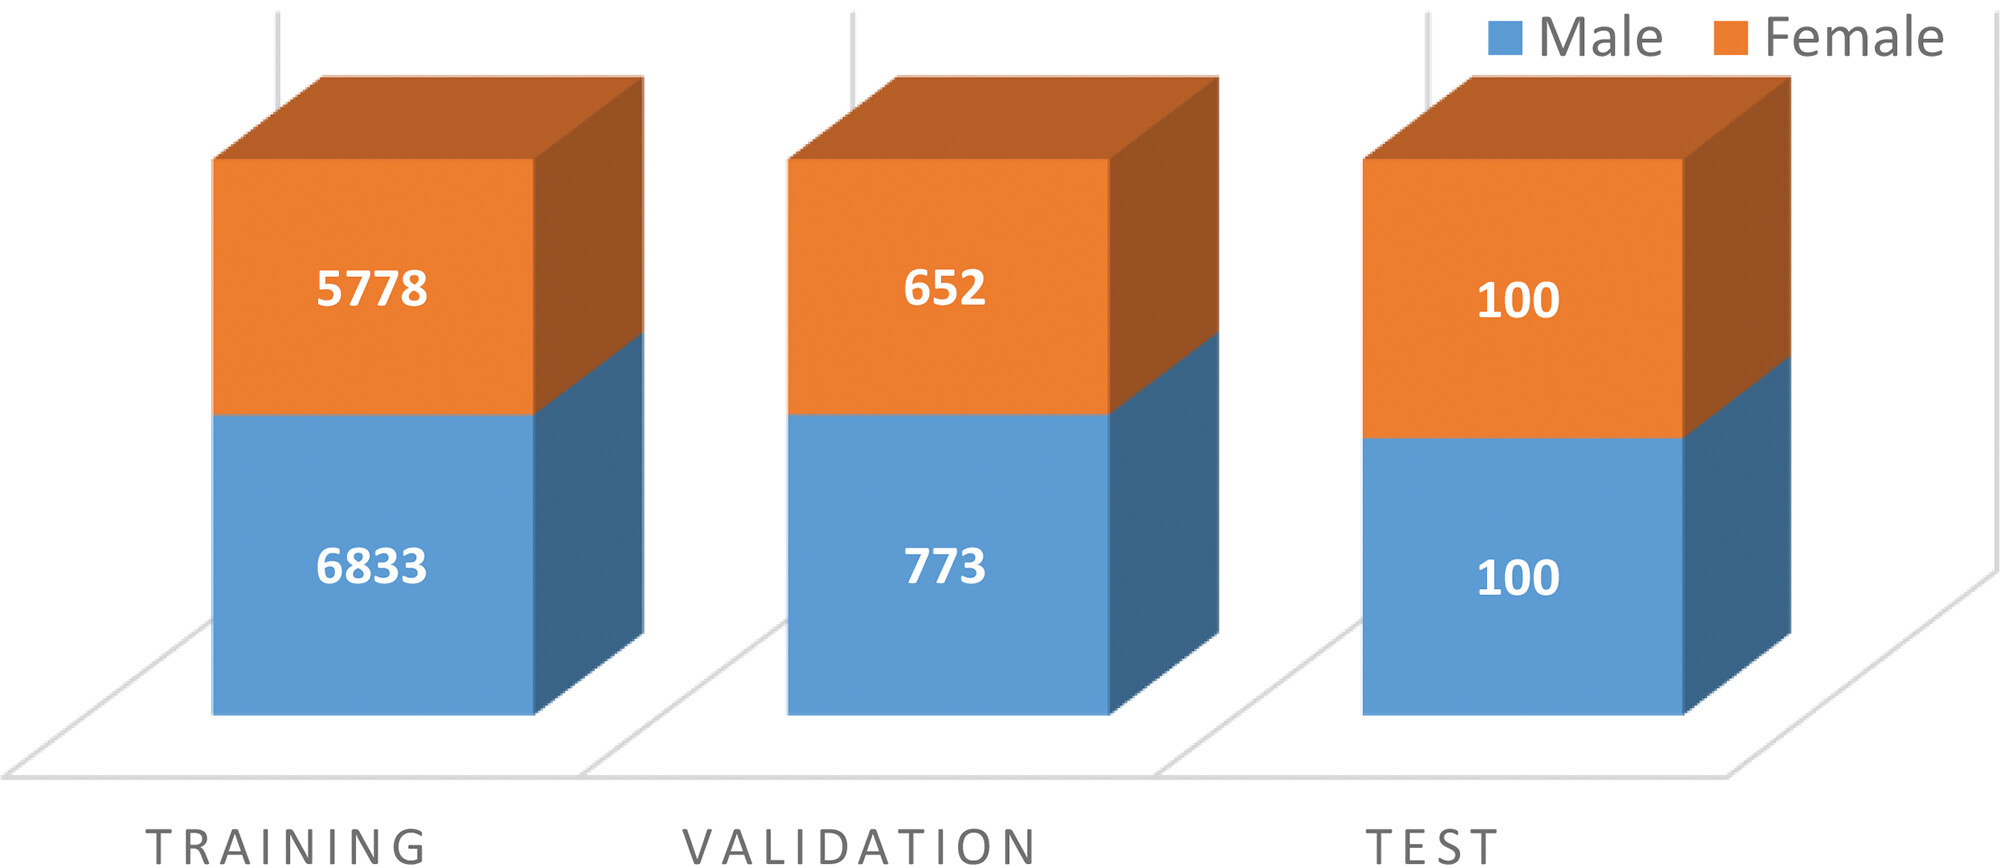
Figure 1: Sex distribution and number of images in the training, validation, and test bone age data sets.
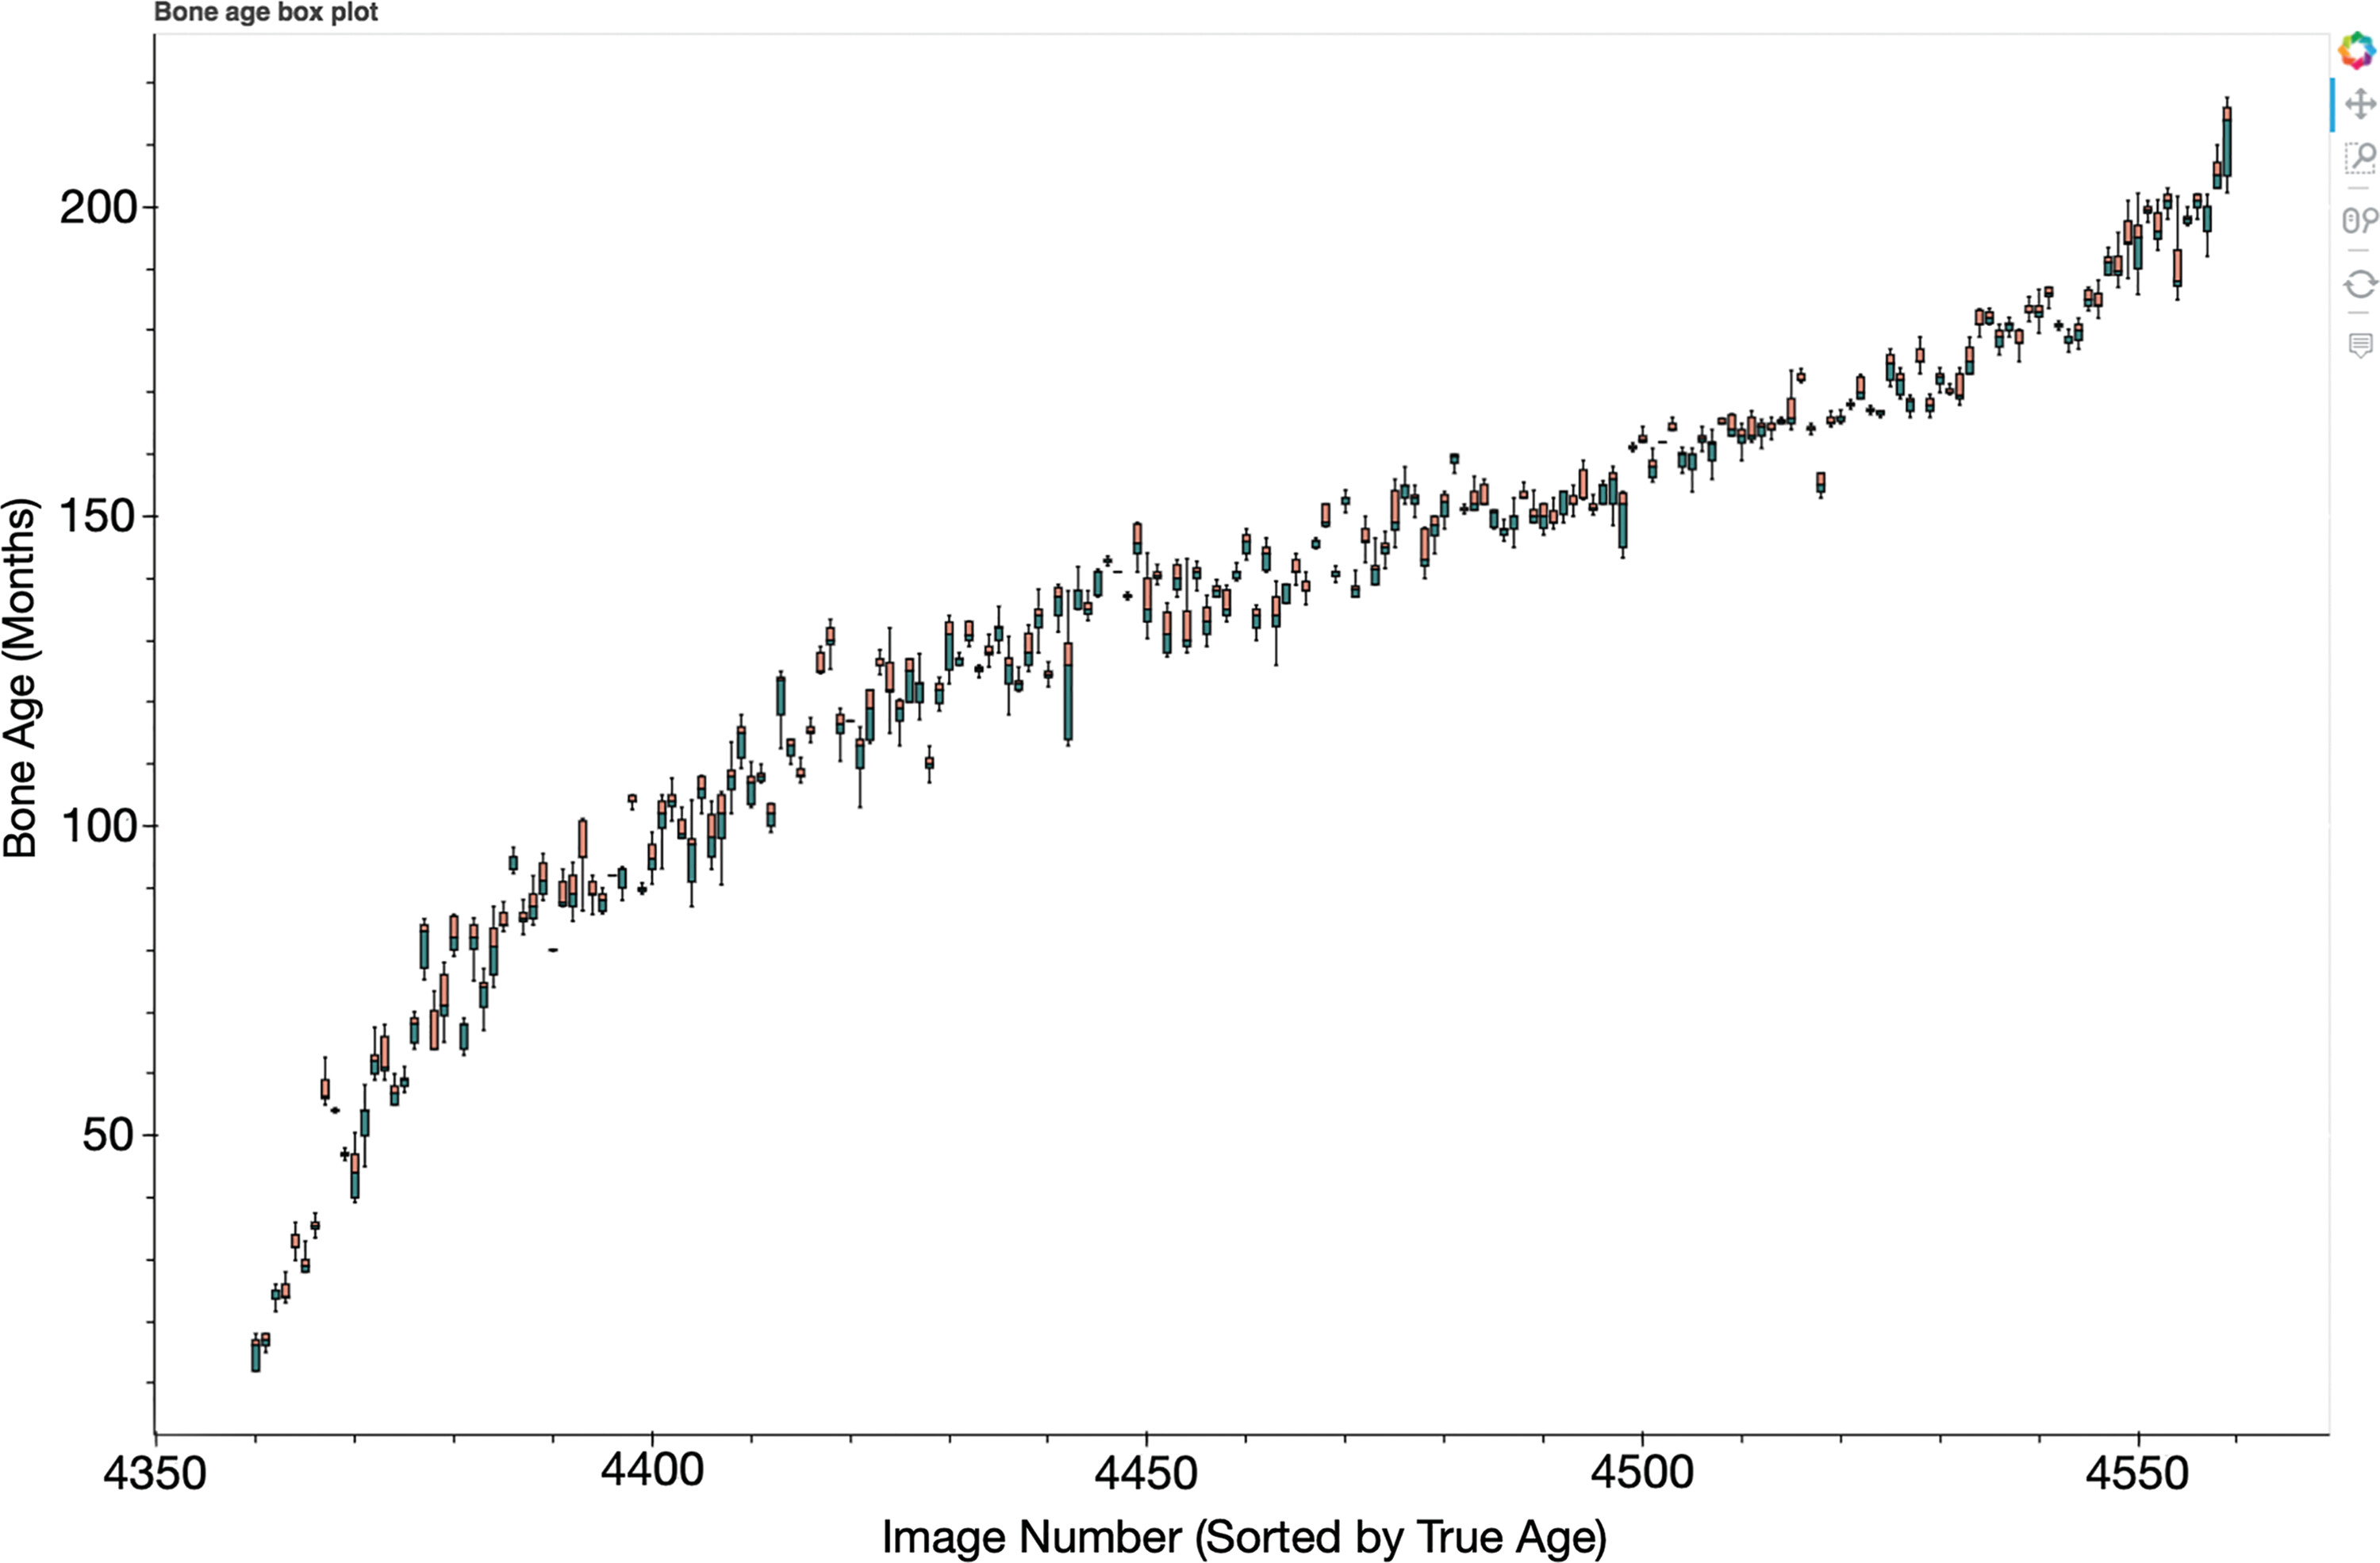
Figure 2: Box plot shows the five best submissions comparing predicted bone age with ground truth. The x-axis represents the image number from the test data set, and the y-axis represents the bone age predicted by the competitors’ models. A full interactive summary of challenge data and analytics, including this box plot, can be accessed at https://rsnachallenges.cloudapp.net:5006/rsna_interactive .
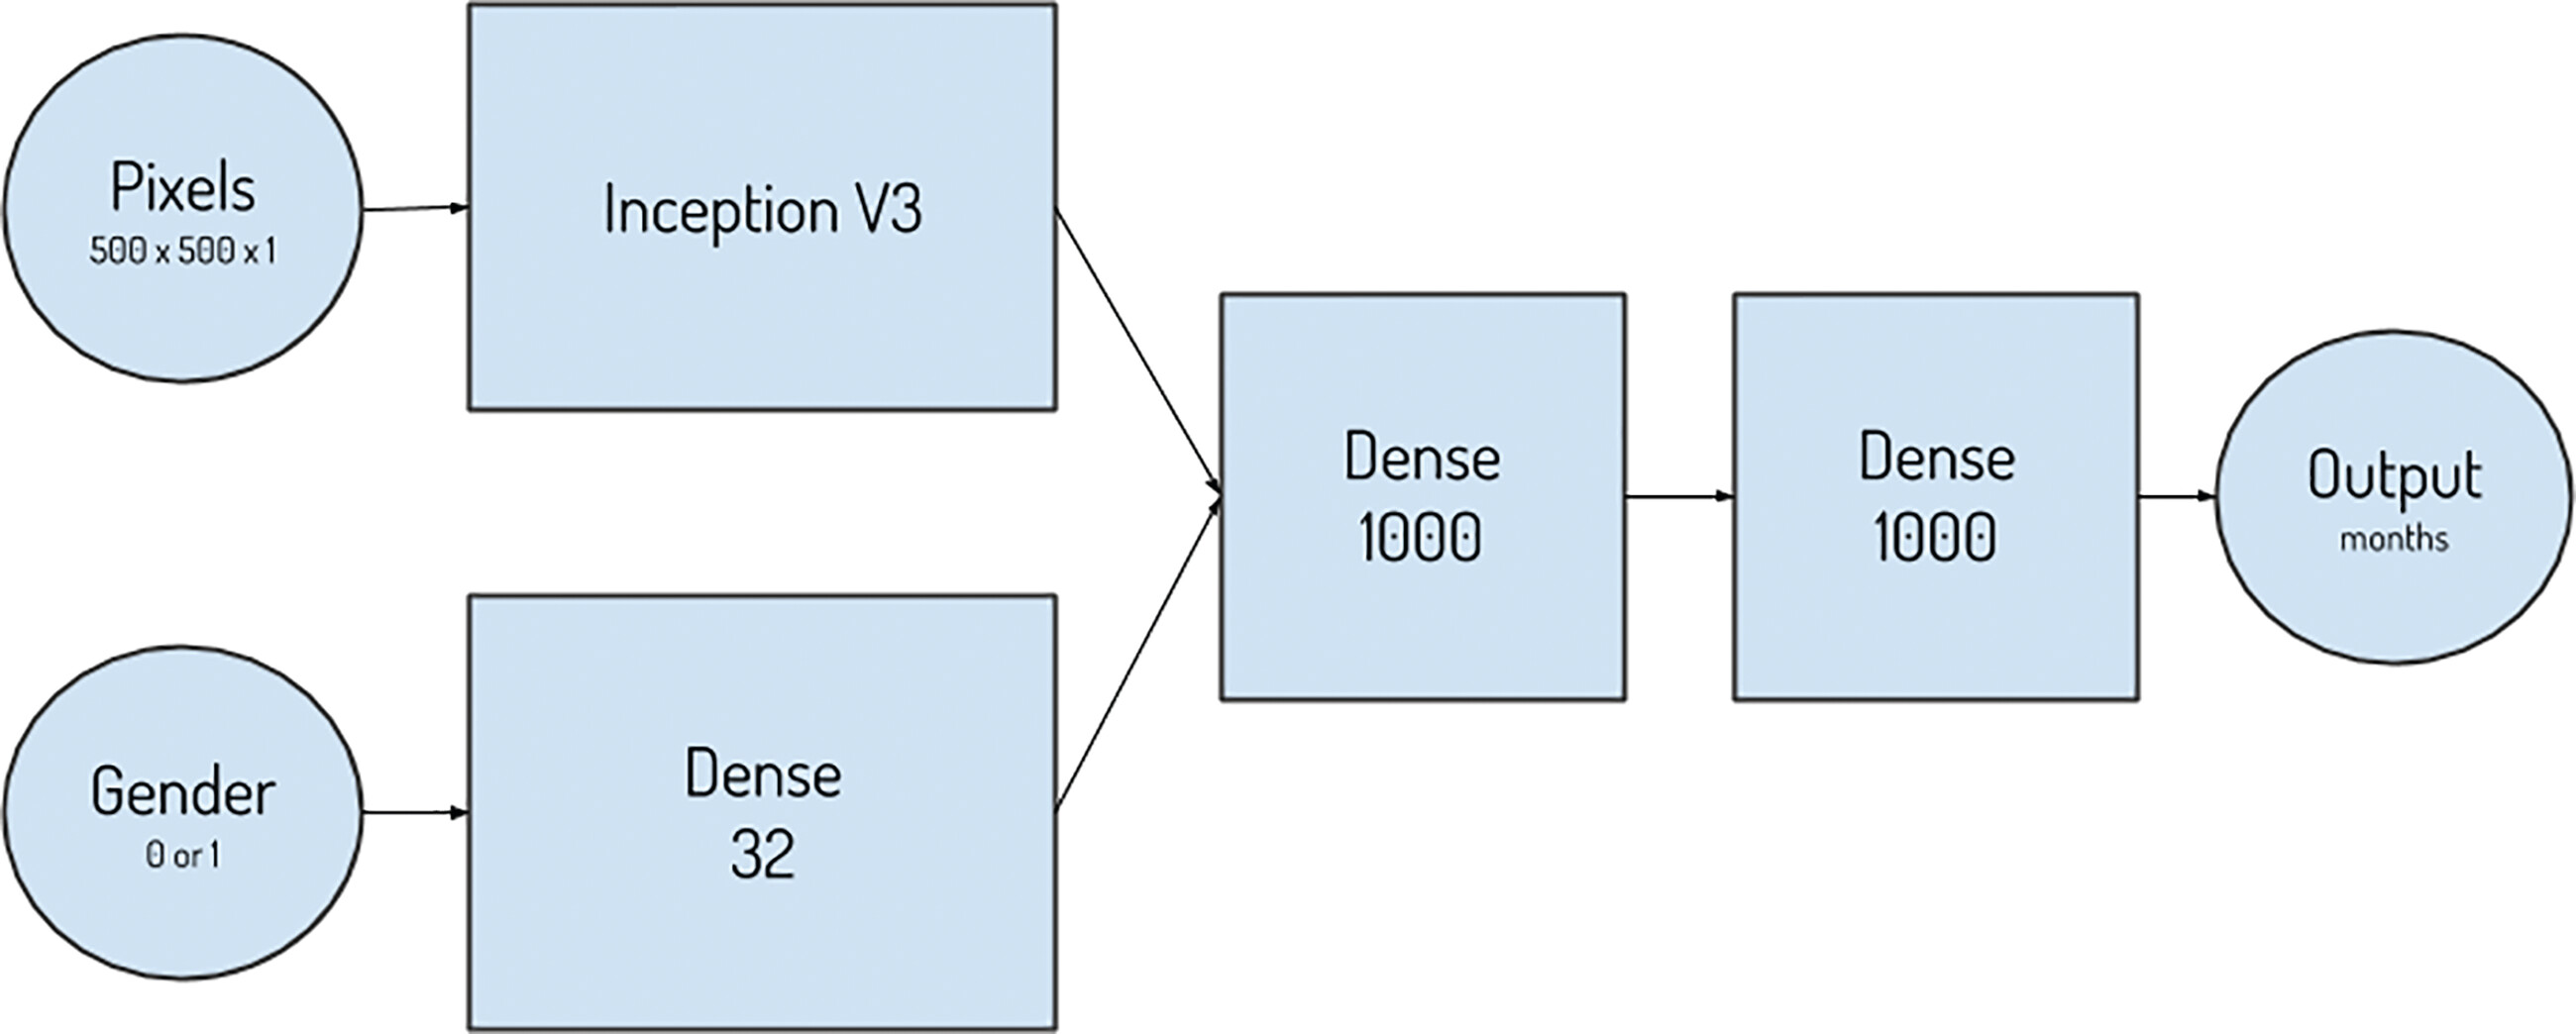
Figure 3: Depiction of the inputs, outputs, and layers of the first-place network design.
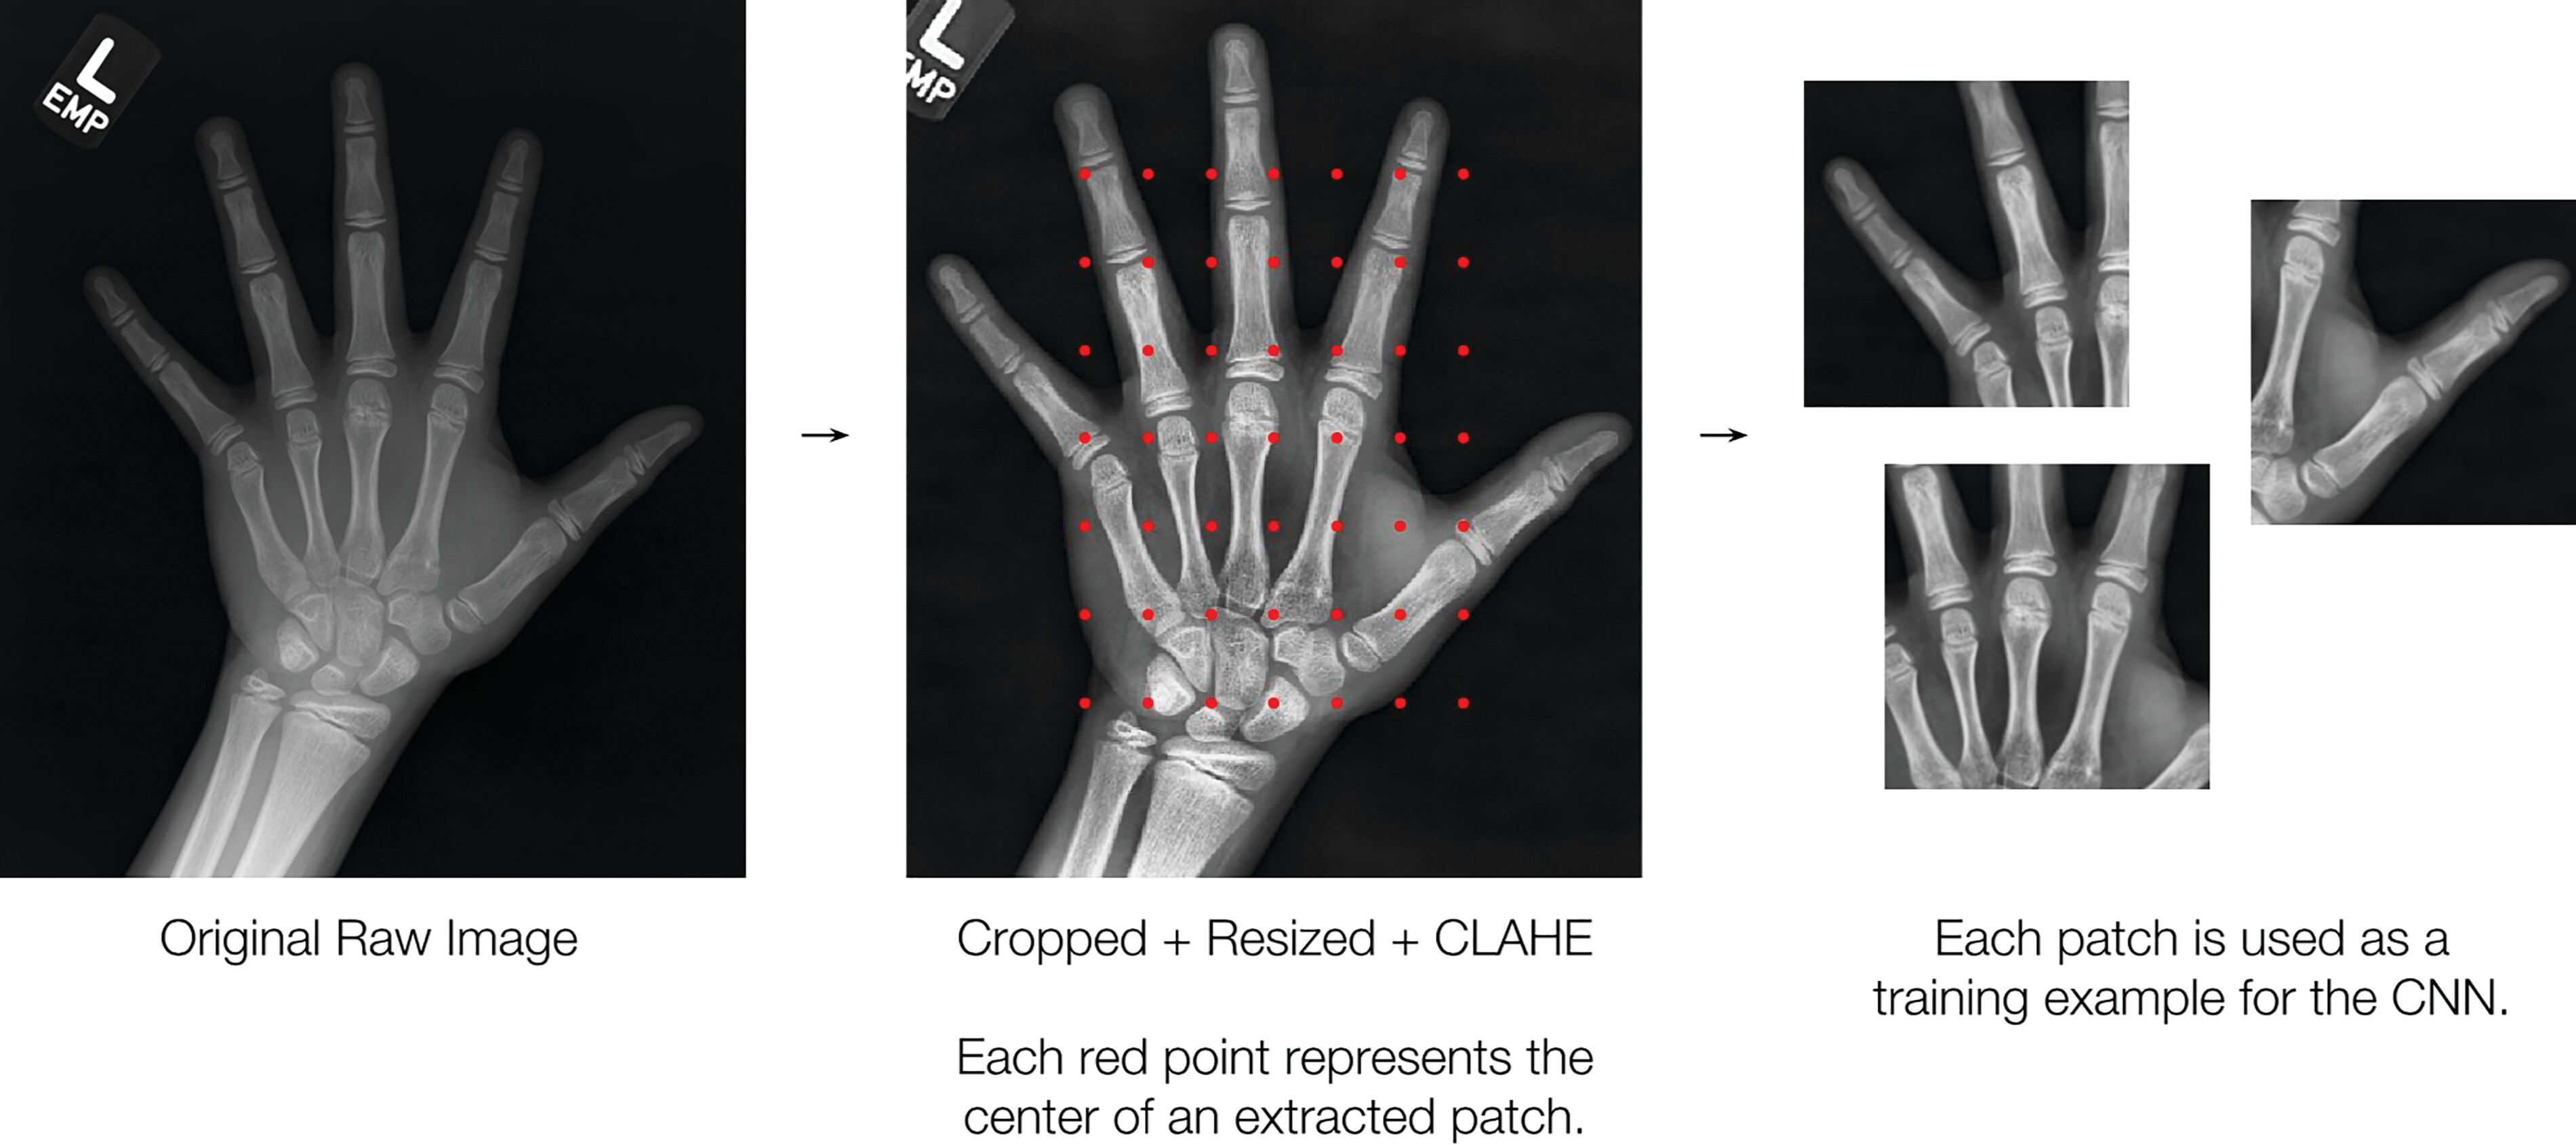
Figure 4: Preprocessing pipeline for the second-place method used to construct inputs to the neural network. The image is manually cropped and resized to a length of 560 pixels, and the contrast is enhanced; this is followed by extraction of 49 patches of 224 × 224 pixels. CLAHE = contrast limited adaptive histogram equalization, CNN = convolutional neural network.
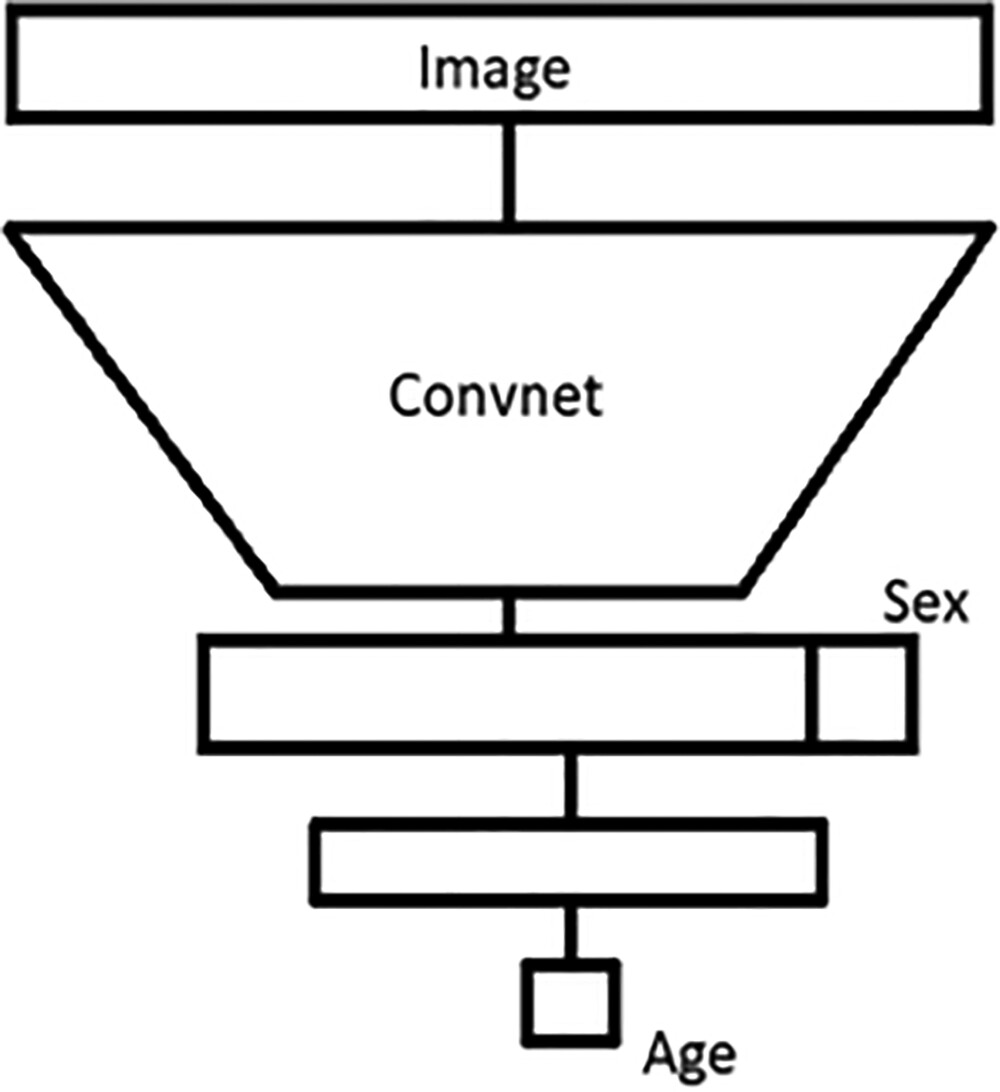
Figure 5: Network architecture of the third-place team shows a convolutional neural network followed by two dense layers. The convolutional layers extract imaging features. The dense layers use imaging features and sex input to output the predicted age.
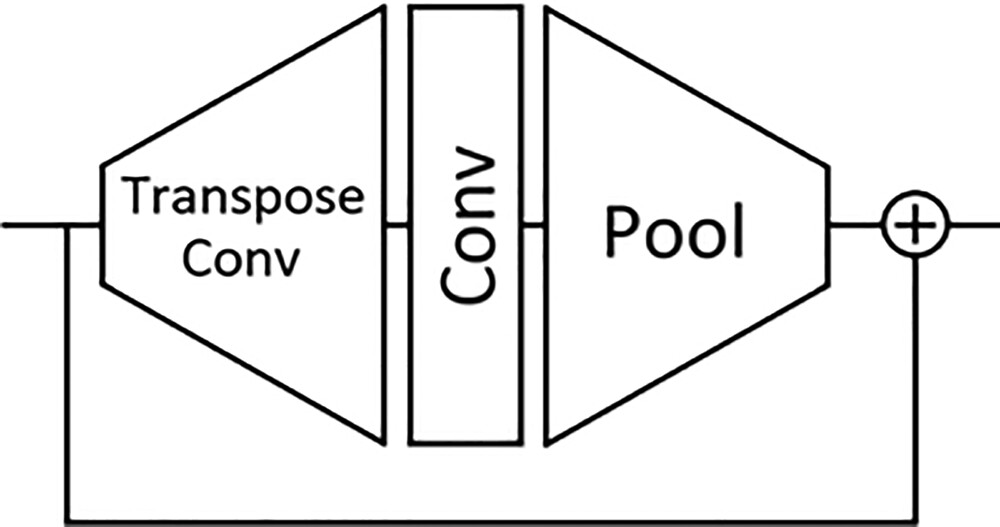
Figure 6: The Ice Module architecture is composed of a transpose convolution followed by a convolutional and pooling layer bypassed by a residual connection. This Ice Module is used in the convolutional part of the network architecture of the third-place team.
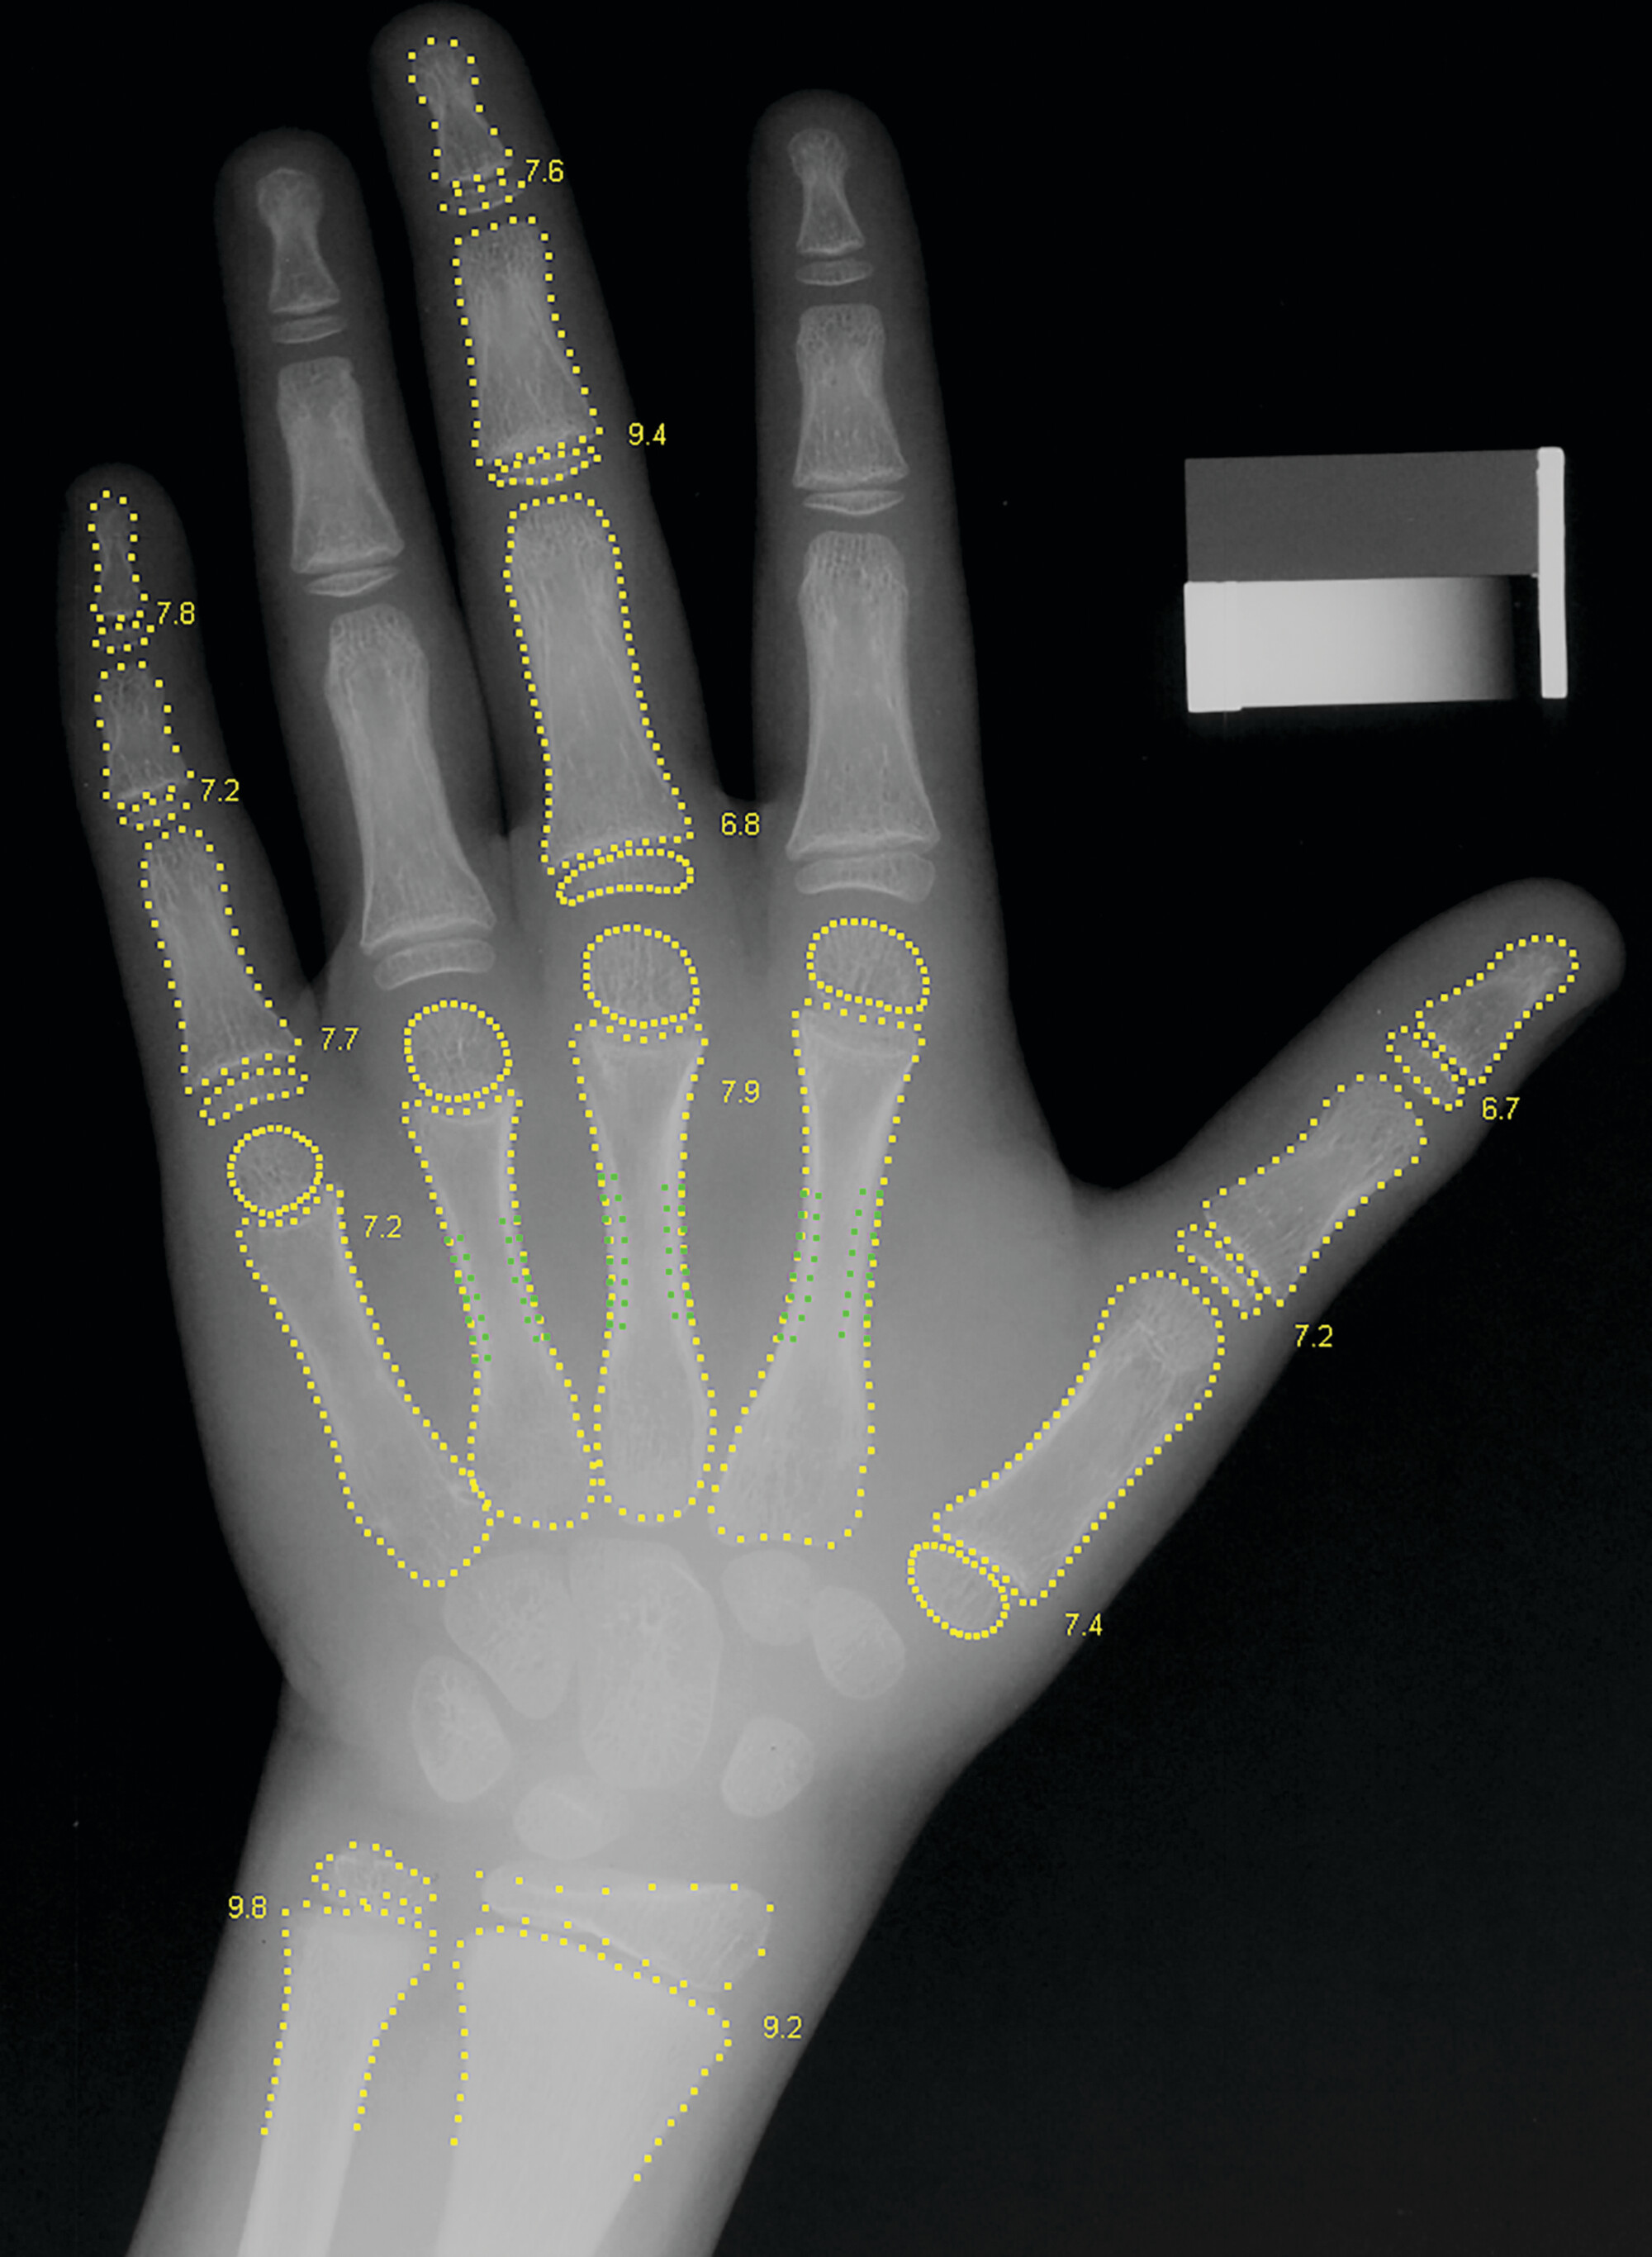
Figure 7: Radiograph of a boy’s left hand shows the preprocessing method used by the fourth-place participant. A bone age value is estimated for each of the 13 bones.
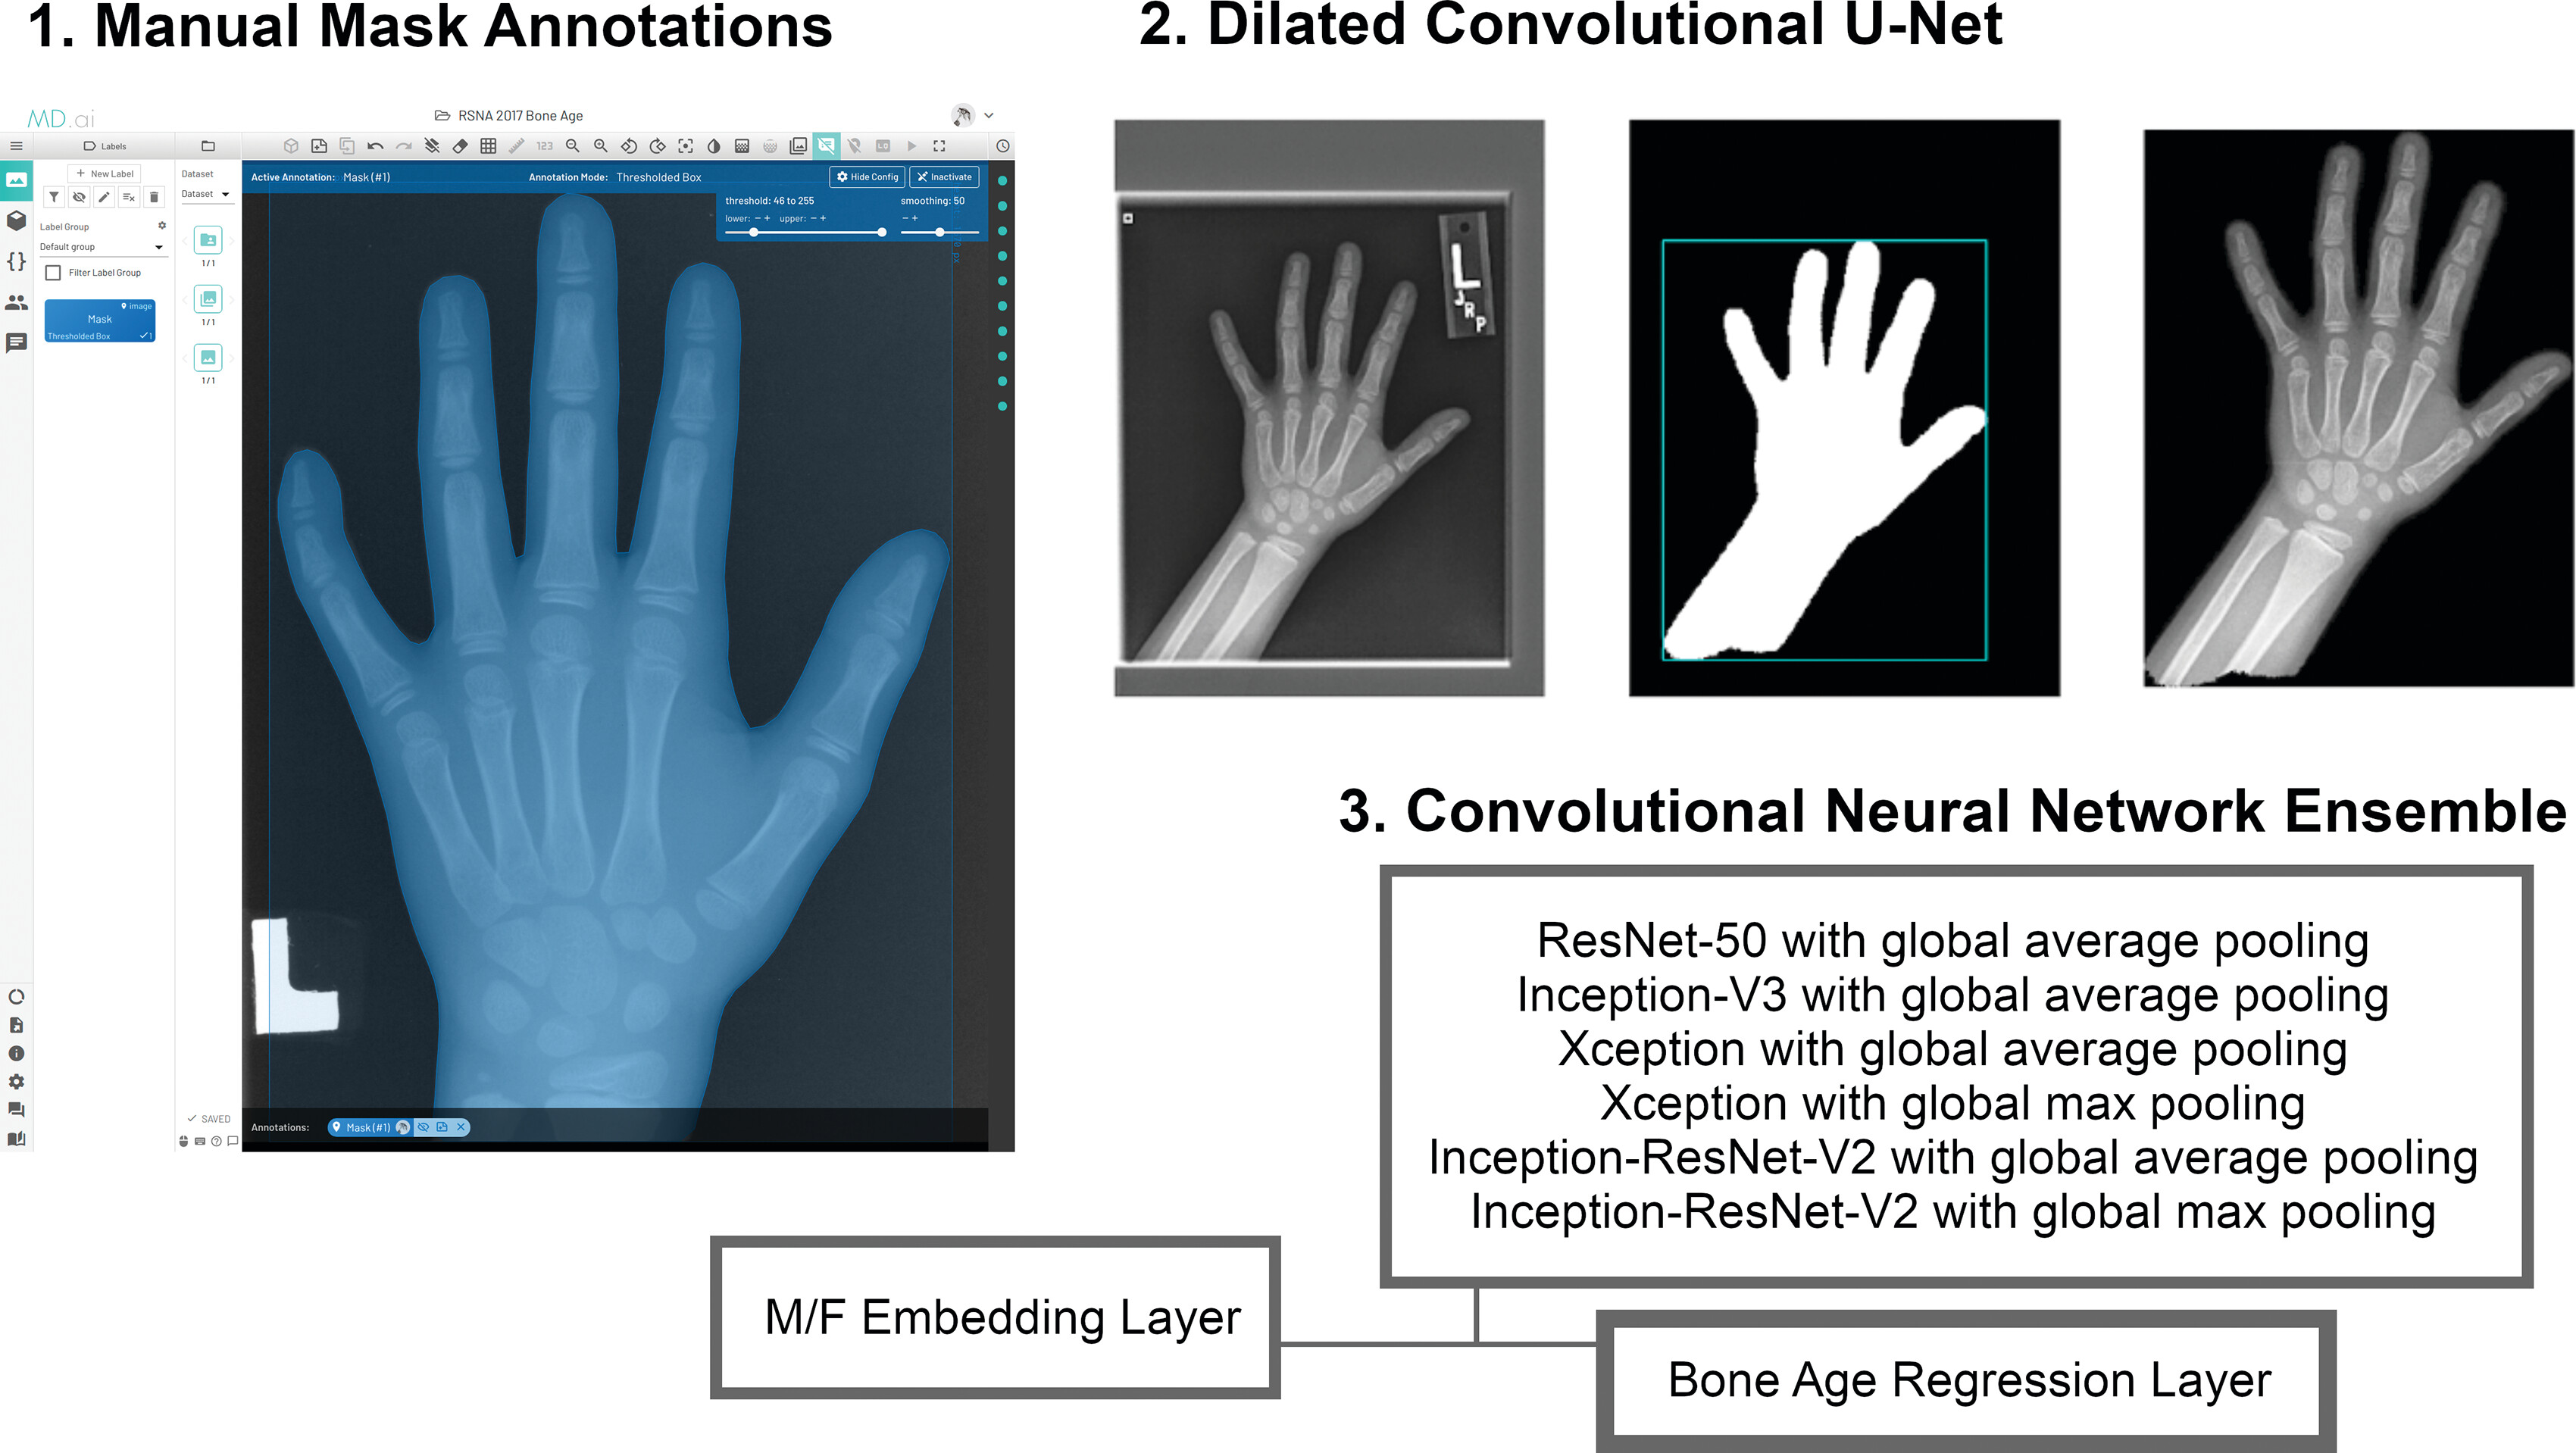
Figure 8: Approximately 400 manual mask annotations were used by the fifth-place team to train a dilated convolutional u-net to generate masks for the remaining (approximately 12 000) hand radiographs. This was then used to train the convolutional neural networks.