Assessing the Performance of Models from the 2022 RSNA Cervical Spine Fracture Detection Competition at a Level I Trauma Center

Summary
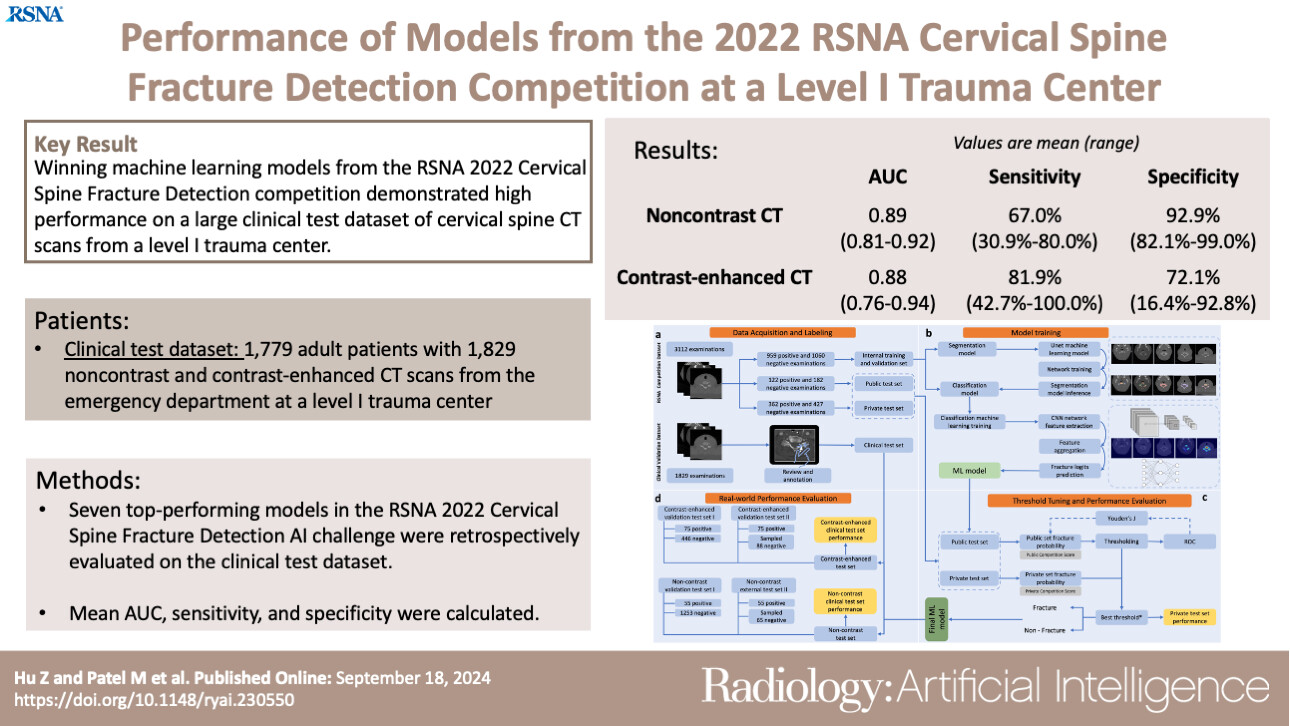
Purpose To evaluate the performance of the top models from the RSNA 2022 Cervical Spine Fracture Detection challenge on a clinical test dataset of both noncontrast and contrast-enhanced CT scans acquired at a level I trauma center. Materials and Methods Seven top-performing models in the RSNA 2022 Cervical Spine Fracture Detection challenge were retrospectively evaluated on a clinical test set of 1828 CT scans (from 1829 series: 130 positive for fracture, 1699 negative for fracture; 1308 noncontrast, 521 contrast enhanced) from 1779 patients (mean age, 55.8 years ± 22.1 [SD]; 1154 [64.9%] male patients). Scans were acquired without exclusion criteria over 1 year (January–December 2022) from the emergency department of a neurosurgical and level I trauma center. Model performance was assessed using area under the receiver operating characteristic curve (AUC), sensitivity, and specificity. False-positive and false-negative cases were further analyzed by a neuroradiologist. Results Although all seven models showed decreased performance on the clinical test set compared with the challenge dataset, the models maintained high performances. On noncontrast CT scans, the models achieved a mean AUC of 0.89 (range: 0.79–0.92), sensitivity of 67.0% (range: 30.9%–80.0%), and specificity of 92.9% (range: 82.1%–99.0%). On contrast-enhanced CT scans, the models had a mean AUC of 0.88 (range: 0.76–0.94), sensitivity of 81.9% (range: 42.7%–100.0%), and specificity of 72.1% (range: 16.4%–92.8%). The models identified 10 fractures missed by radiologists. False-positive cases were more common in contrast-enhanced scans and observed in patients with degenerative changes on noncontrast scans, while false-negative cases were often associated with degenerative changes and osteopenia. Conclusion The winning models from the 2022 RSNA AI Challenge demonstrated a high performance for cervical spine fracture detection on a clinical test dataset, warranting further evaluation for their use as clinical support tools. Keywords: Feature Detection, Supervised Learning, Convolutional Neural Network (CNN), Genetic Algorithms, CT, Spine, Technology Assessment, Head/Neck Supplemental material is available for this article. © RSNA, 2024 See also commentary by Levi and Politi in this issue.
Key points
- Seven of the top-performing machine learning models from the RSNA 2022 Cervical Spine Fracture Detection artificial intelligence challenge generalized well to the clinical test dataset, with mean area under the receiver operating characteristic curve values of 0.89 (range: 0.79–0.92) for fracture detection on noncontrast CT scans and 0.88 (range: 0.76–0.94) on contrast-enhanced CT scans.
- The models achieved a mean sensitivity of 67.0% (range: 30.9%–80.0%) and mean specificity of 92.9% (range: 82.1%–99.0%) on noncontrast CT scans and a mean sensitivity of 81.9% (range: 42.7%–100.0%) and mean specificity of 72.1% (range: 16.4%–92.8%) on contrast-enhanced CT scans.
- The machine learning models identified 10 fractures missed by reporting radiologists out of 116 cases, and poorer model performance was most often attributed to contrast-enhanced scans and scans in patients with degenerative changes and osteopenia.
Introduction
Traumatic cervical spinal injuries are common and associated with high morbidity and mortality rates 1. The incidence of cervical spine injuries is 16.5 per 100 000 individuals 2, and the prevalence is 1.7%–3.7% in patients with blunt trauma 3,4. CT is the reference standard modality for detection of cervical spine fractures 5, with trauma patients often undergoing CT examinations covering their entire neuroaxis, chest, abdomen, and pelvis. In busy clinical environments, where radiologists are facing increasing workloads, delays between imaging and interpretation can potentially lead to adverse outcomes 6. Up to a quarter of patients experience progression of their injuries due to delays in diagnosis or unwarranted manipulation 7. Early immobilization of unstable injuries can prevent neurologic deterioration 8, and prompt surgical intervention is associated with better outcomes 9.
The increasing volume of imaging studies and demand for rapid diagnosis have led to the exploration of machine learning (ML) to aid the imaging review process. For example, ML models can assist radiologists in the detection and characterization of abnormalities, such as brain tumors 10, wrist fractures 11, and intracranial hemorrhage 12. Studies have also explored the use of ML for detection of spinal fractures with deep neural network models 13 showing high sensitivities (>95%) 14 and some matching the performance of radiologists 15. However, most of these studies focused on osteoporotic vertebral fractures, which are more likely to be stable and rarely found in the cervical spine. To date, there are relatively few studies exploring the application of ML models to aid cervical spine fracture detection in the acute trauma setting.
A major factor preventing widespread clinical implementation of ML models is the limited access to data. Clinical data are often fragmented, stored in disparate systems, and subject to privacy regulations 16, making it challenging to access a sufficiently large and diverse dataset. Even when accessible, data may have quality issues and biases 16,17. In addition, data annotation can be labor intensive and expensive and requires substantial medical expertise and time 16.
Initiatives such as the RSNA artificial intelligence challenges play a crucial role in mitigating some of these issues and have been ongoing for several years 18. Through these competitions, the RSNA is able to crowdsource multi-institutional and multinational datasets, expertise, and insights into relevant clinical issues. Top-performing models from prior RSNA competitions have been shown to generalize well to real-world external testing datasets 19,20. The goal of the RSNA 2022 Cervical Spine Fracture Detection competition was to develop ML models that detect and localize fractures in the cervical spine 21 with 1108 global competitors participating. Eight participants were awarded the gold prize for models that demonstrated exceptional performance on the private test set, with scores and rankings available on the competition’s leaderboard 22.
This study examines the performance of the top ML models from the RSNA 2022 Cervical Spine Fracture Detection competition on a clinical validation dataset. Although the RSNA competition dataset is based on real-world multi-institutional data, it was curated with the intention of hosting a competition. Each contributing site was requested to provide an equivalent number of positive and negative cases, resulting in a substantially higher fracture prevalence than real-world rates. The identification and extraction of data were left to the discretion of each site 21, which introduces the potential for selection biases. The data also underwent filtration during curation, removing examinations with incomplete coverage of the cervical spine, prior surgery, intravenous contrast material, and motion artifacts. The clinical validation dataset in this study included all consecutive emergent CT scans that were acquired over the course of a calendar year at a busy urban neurosurgical and level I trauma center. In contrast to the RSNA competition dataset, this test set includes contrast-enhanced scans, as patients often receive contrast material as part of full-body trauma imaging at major trauma centers.
Materials and Methods
This retrospective study was approved by the institutional review board at Unity Health Toronto with a waiver of informed consent.
RSNA 2022 Competition Dataset
The RSNA 2022 Cervical Spine Fracture Detection competition took place from July 28 to October 27, 2022. The competition dataset, consisting of 3112 cervical spine noncontrast CT scans from 12 institutions, was used for model training and internal testing. The dataset was divided into training (2019 scans), public testing (304 scans), and private testing (789 scans) sets, with fracture prevalence rates of 47.6% (961 of 2019), 40.1% (122 of 304), and 45.9% (362 of 789), respectively, notably higher than typical real-world rates of 4%–7% 23,24. Detailed information about the dataset can be found in the work by Lin et al 21.
Models
We selected seven of the eight award-winning models based on their scores on the RSNA competition’s private dataset 25 to rigorously evaluate their ability to generalize. The second-place model was excluded from our study as we were unable to reproduce its performance on the private competition test set using the provided source code and technical posts. The seven models we examined leveraged state-of-the-art techniques in computer vision and deep learning. The general strategy adopted by these models is a two-stage approach: segmentation and classification ( Fig 1 ). A detailed description of the models is provided in Appendix S2 .
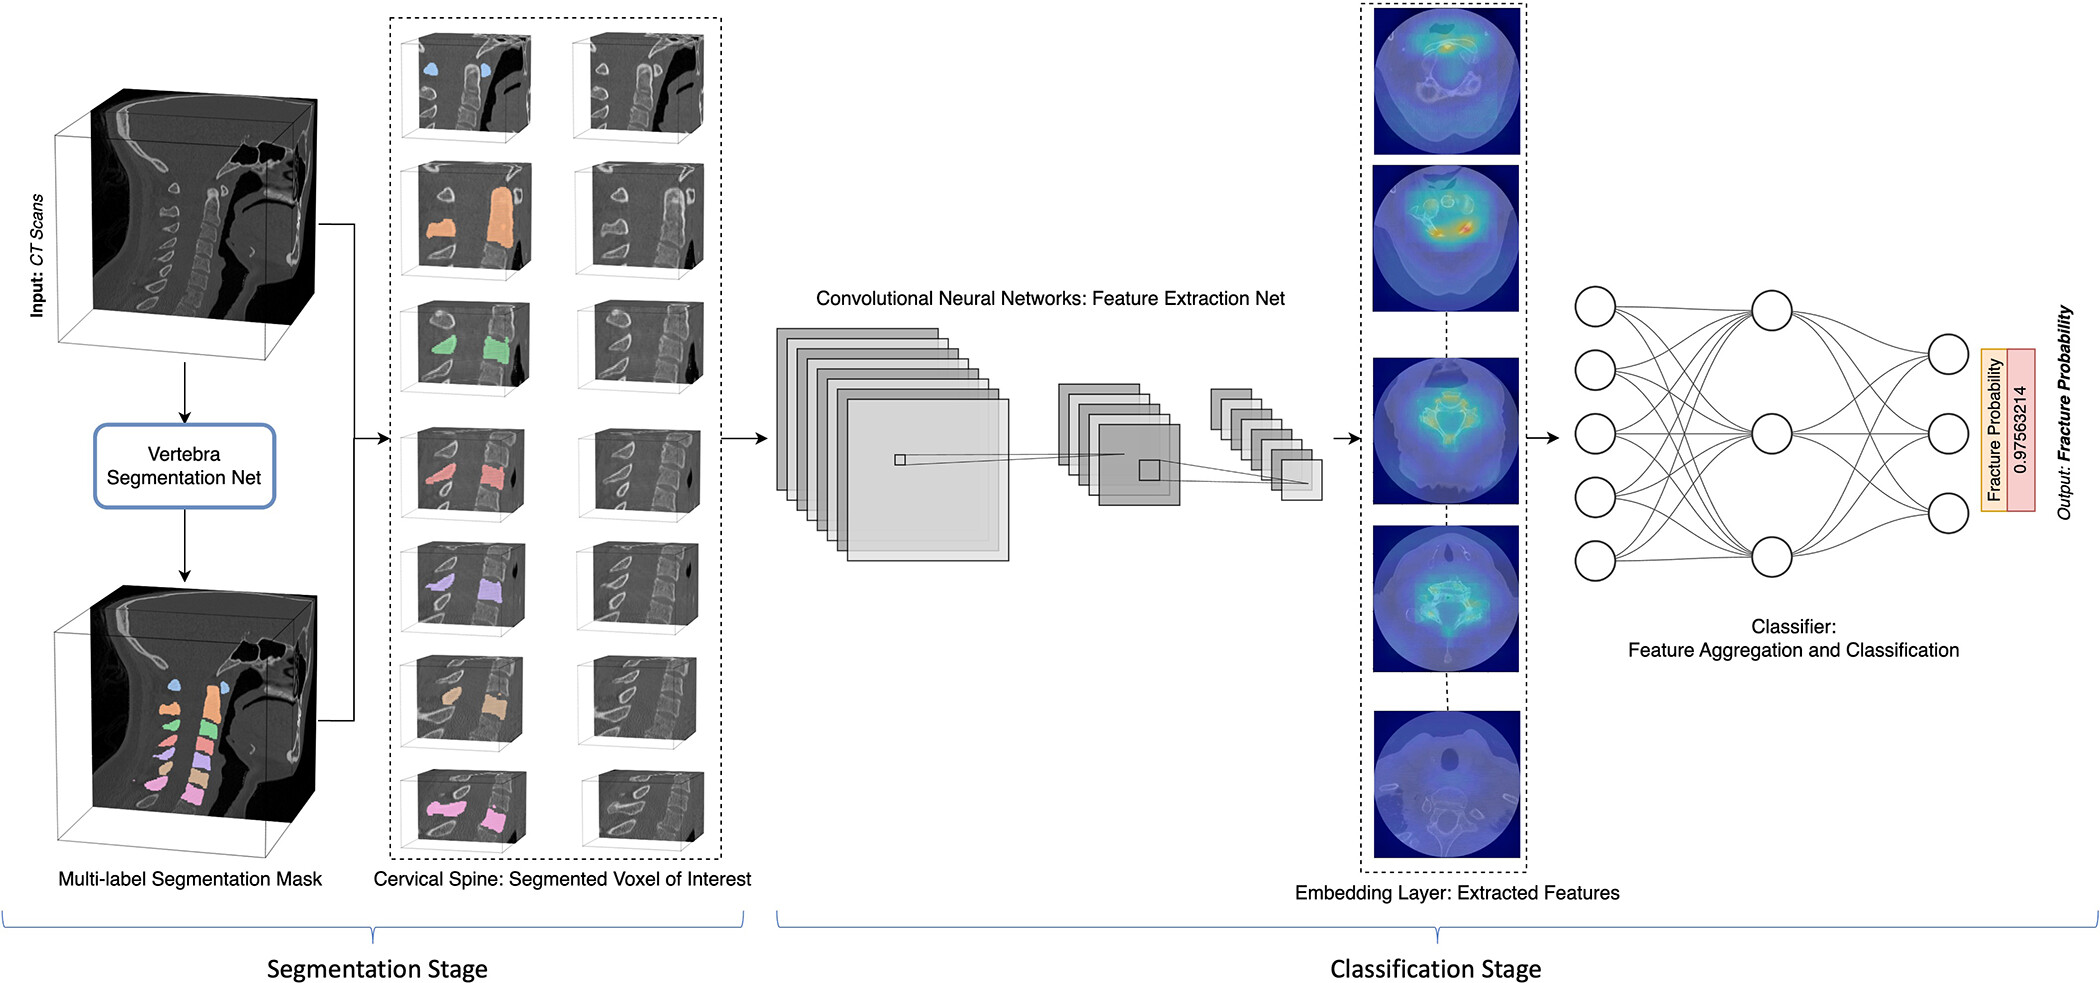
Figure 1: Graphic displays an example of end-to-end architecture of a cervical spine CT fracture detection machine learning model, showcasing the segmentation stage to isolate the cervical spine’s voxels of interest, followed by the classification stage for feature extraction, aggregation, and logits prediction.
Evaluation of Model Generalizability
Figure 2 displays the general workflow to evaluate model performance in the clinical setting. To better understand model generalizability, we analyzed model performance on a clinical test dataset composed of consecutive cervical spine CT scans obtained over the course of 1 year (January 1–December 31, 2022) for a traumatic indication at a busy urban neurosurgical and level I trauma center (St Michael’s Hospital, Unity Health Toronto). Inclusion criteria were scans obtained in the emergency department for individuals older than age 18, with no exclusion criteria. The dataset included both noncontrast scans and contrast-enhanced scans. CT scans were downloaded via Philips Vue picture archiving and communication system (Philips Healthcare) and filtered for axial bone window images of the cervical spine measuring 1 mm or less in section thickness. Additional details about the dataset, including CT scan acquisition parameters, are provided in Appendix S1 . The noncontrast scans were similar to the data used to train and evaluate models during the competition, while the contrast-enhanced scans allowed for the evaluation of model generalizability outside the distribution of the training data. Of note, this test dataset was not considered a purely “external” dataset, as our institution contributed data to the competition; however, none of those patients were represented in this dataset.
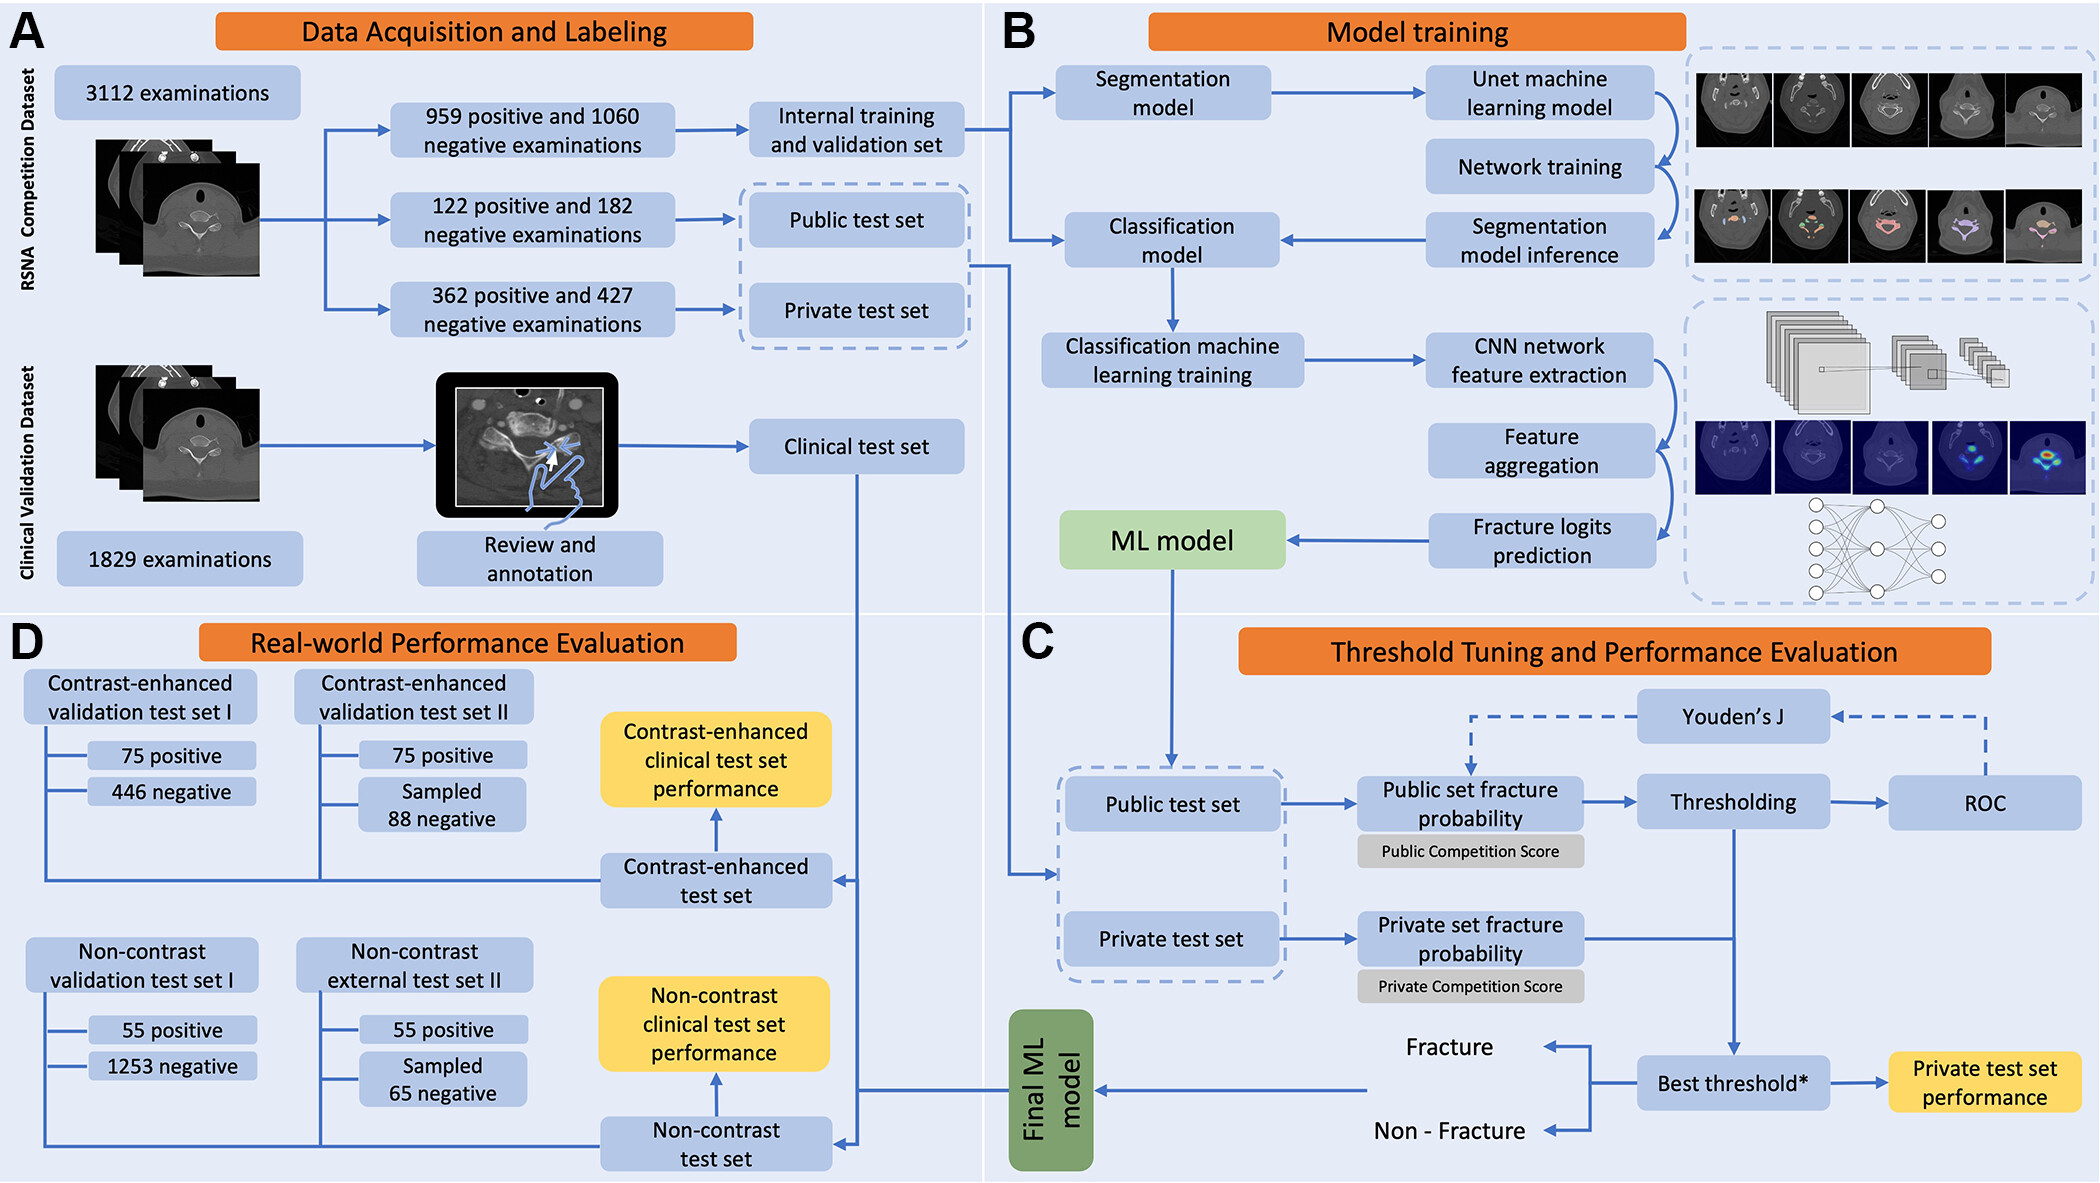
Figure 2: Flowchart of machine learning (ML) evaluation pipeline for cervical spine fracture detection. (A) The process starts with 3112 CT scans from the RSNA 2022 competition, divided into training, public test, and private test datasets. Additional CT scans from our institution are used as the clinical test dataset. (B) Each ML model has two main stages: segmentation, typically using two-dimensional or three-dimensional U-Net, and classification involving convolutional neural network (CNN) feature extraction, feature aggregation, and logits prediction. (C) Each model generates a fracture probability output binarized by applying an optimal threshold identified by the Youden J statistic on the public test dataset. Then the model’s performance is assessed using the private test dataset. (D) The final evaluation comprises four subsets of the clinical test dataset: noncontrast scans, contrast-enhanced scans, bootstrap-sampled noncontrast scans, and bootstrap-sampled contrast-enhanced scans. ROC = receiver operating characteristic.
Reference Standard Labeling
To obtain reference standard labels, our radiology information system (Syngo; Siemens Medical Solutions) was searched for reports on emergency department cervical spine CT scans performed between January 1 and December 31, 2022, using mPower (Nuance Communications) in patients at least 18 years of age. Reports were classified as positive or negative for fracture at the patient and cervical spine segmental levels by a radiologist (M.N., 21 years of experience). The reference standard was established for equivocal reports by reviewing follow-up imaging examinations and clinical records. A random sample of 10% of the radiology reports were reviewed by a second radiologist (E.C., 15 years of experience), with 100% concordance at the segmental level. The presence or absence of intravenous contrast material was also established for each scan. Additional dataset curation details are provided in Appendix S1 .
Review of False-Negative and False-Positive Cases
A neuroradiologist (S.M., 6.5 years of neuroradiology experience) reviewed every examination-level false-negative case to help determine the types of fractures missed by the ML models. CT scans that were misclassified as false positive at the examination level by at least four of the seven models also underwent review. This approach was pursued as two models (Skecherz and Harshit) accounted for a substantial proportion of false-positive cases, whereas many of these were correctly classified by the other models. Heat maps from gradient-weighted class activation mapping (Grad-CAM) 26 were generated based on the averaged model outputs for false-positive classifications. Grad-CAM is a visualization technique that illuminates areas of an image influencing convolutional neural network prediction by highlighting these regions with heat maps. To interpret these maps, warmer colors (eg, red) indicate areas the model focused on more intensely, with brighter colors signifying higher influence on the model’s decision. These heat maps allowed the neuroradiologist to concentrate on identifying commonly occurring features that may have misguided the model’s judgment.
Statistical Analysis
The Youden J statistic 27 was used on the competition’s public test dataset to determine optimal thresholds to binarize predicted probabilities that maximize the difference between the true-positive rate and the false-positive rate, effectively capturing the top-left-most point on the receiver operating characteristic curve. The thresholds for each of the seven models (Threshold Qishen = 0.72, Threshold Darragh = 0.54, Threshold Selim = 0.57, Threshold Speedrun = 0.81, Threshold Skecherz = 0.49, Threshold QWER = 0.54, Threshold Harshit = 0.72) were then applied to the competition’s private test set to establish baseline model performance on the competition dataset. Reference standard labels for each scan were compared with the ML model predictions. Sensitivity, specificity, positive predictive value, negative predictive value, accuracy, area under the receiver operating characteristic curve (AUC), and F1 score were the primary evaluation metrics.
Mean values and ranges (minimum, maximum) were calculated for each metric across all seven models. Additionally, the CIs were estimated separately for each individual model’s performance. Specifically, the binomial method was used for accuracy, sensitivity, specificity, positive predictive value, and negative predictive value 28, while the Takahashi method was used for the F1 score 29 and the DeLong method for the AUC 30.
Model performances on the competition private test set and the clinical test set were compared to identify any differences or trends. Additional analyses, including those adjusting the clinical test dataset to match the competition dataset’s prevalence, are detailed in Appendix S1 .
Statistical analyses were performed using the Python libraries Scikit-learn (version 1.3.2), SciPy (version 1.11.4), and Confidenceinterval (version 1.0.4). Statistical significance of differences in model performances was not formally assessed in this study.
Data and Model Availability
The publicly available RSNA 2022 Cervical Spine Fracture Detection CT dataset and competition award-winning models are available at https://www.kaggle.com/competitions/rsna-2022-cervical-spine-fracture-detection . The competition private test and clinical test dataset are not publicly available.
Our analysis and model implementation were conducted using Python (version 3.10.13) and torch (version 2.1.0). Additionally, we used a suite of Python packages to facilitate data analysis and results visualization, including SimpleITK (version 2.3.1), nibabel (version 5.2.0), torchvision (version 0.16.1), NumPy (version 1.26.2), scikit-image (version 0.22.0), opencv-python (version 4.8.1), pandas (version 2.1.4), matplotlib (version 3.8.0), and Grad-CAM (version 1.4.8). The detailed enumeration of the software and packages used aims to enhance the reproducibility and transparency of our study.
Results
Characteristics of the Clinical Test Set
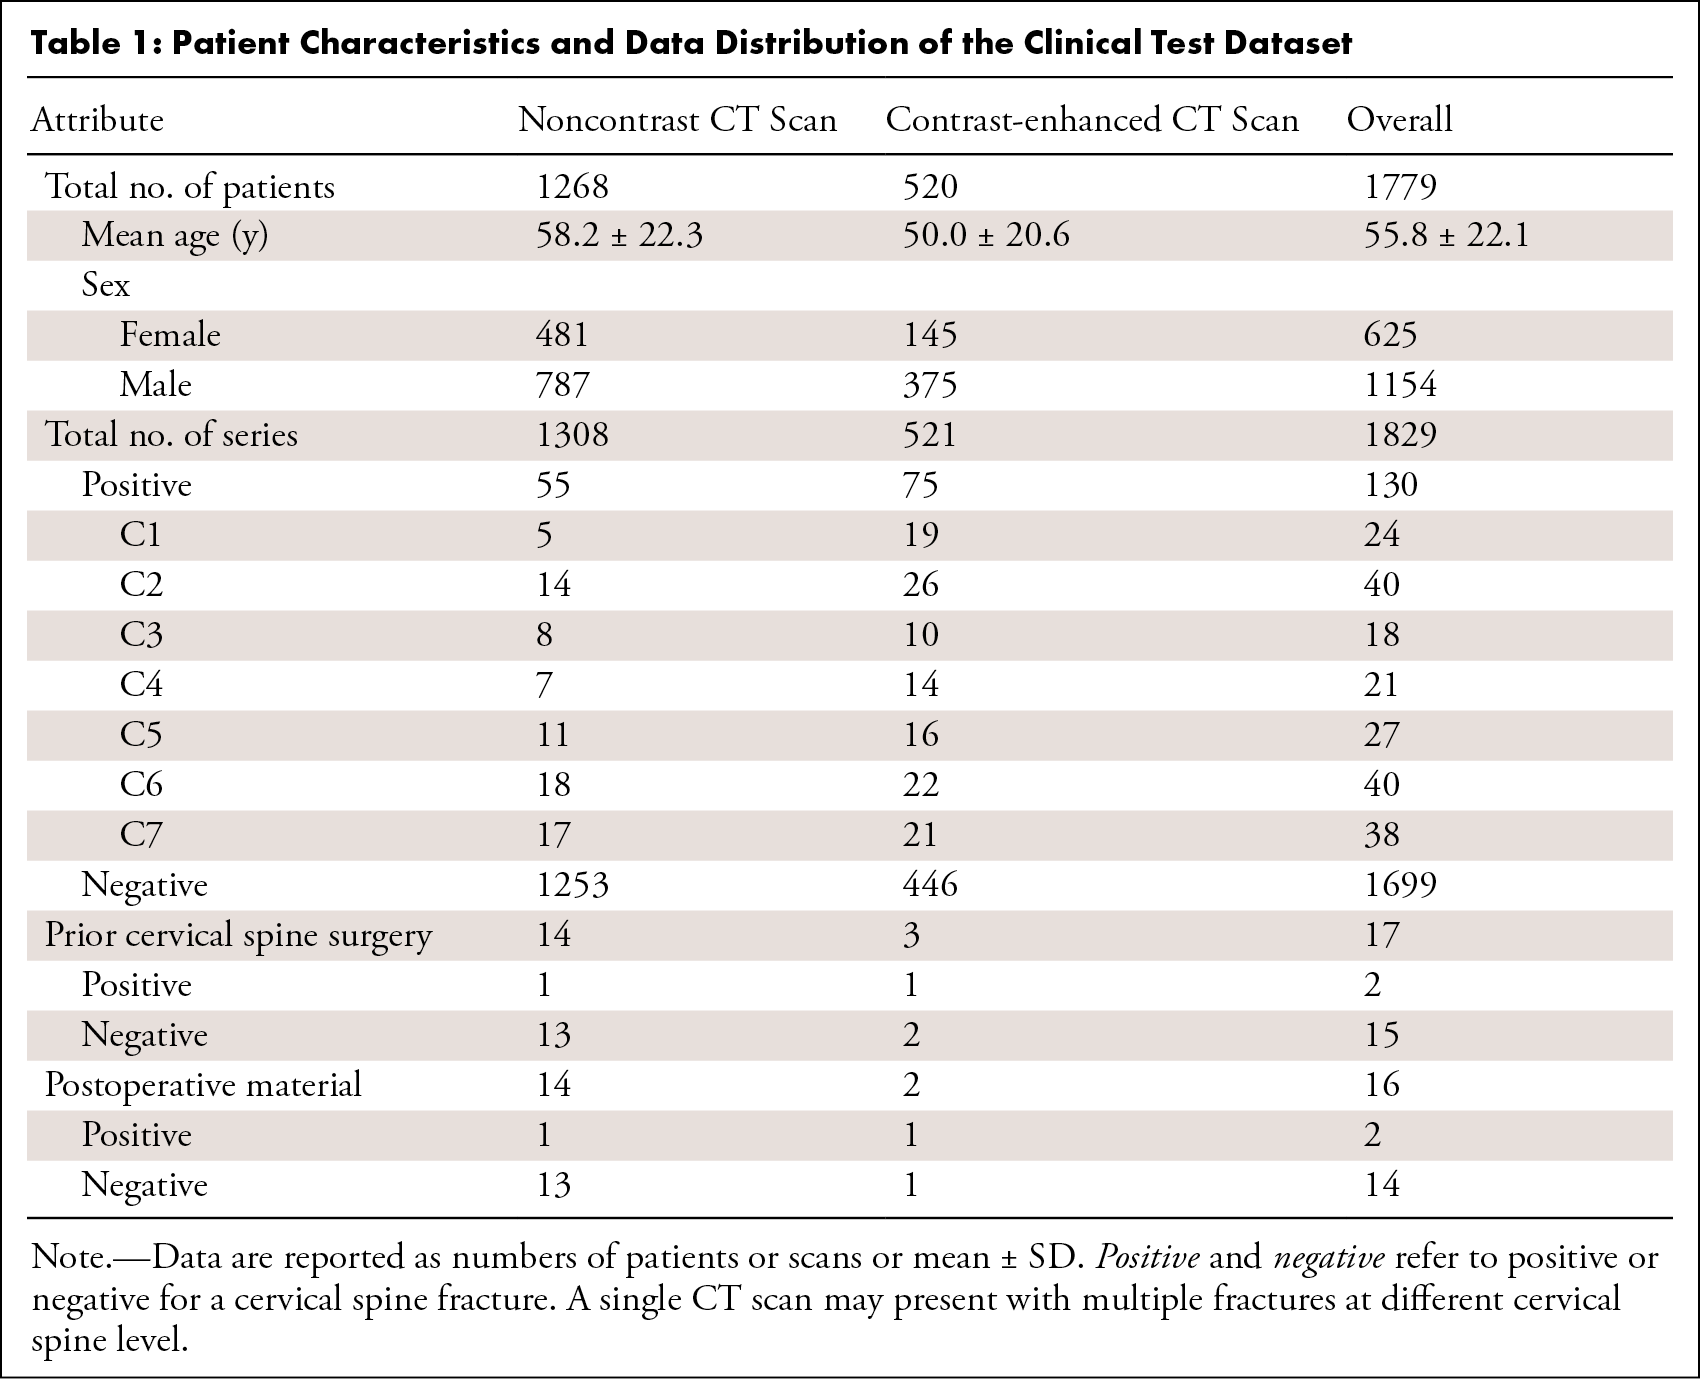
The clinical test set used in this study was composed of 1829 series from 1828 cervical spine CT studies across 1779 adult patients (625 [35.1%] female patients, 1154 [64.9%] male patients; age range, 18–101 years; mean age, 55.8 years ± 22.1 [SD]); a minority of patients had either pre- and postcontrast scans or repeat attendances to the emergency department. There were 130 scans positive for fracture. The dataset included 1308 noncontrast and 521 contrast-enhanced scans ( Table 1 ).
Performance of Models on Each Dataset
Figure 3 shows the distribution of performance metrics for binary classification by the winning algorithms on different datasets. Detailed information regarding other analyses are provided in Appendix S1 and Tables S2 – S5 .
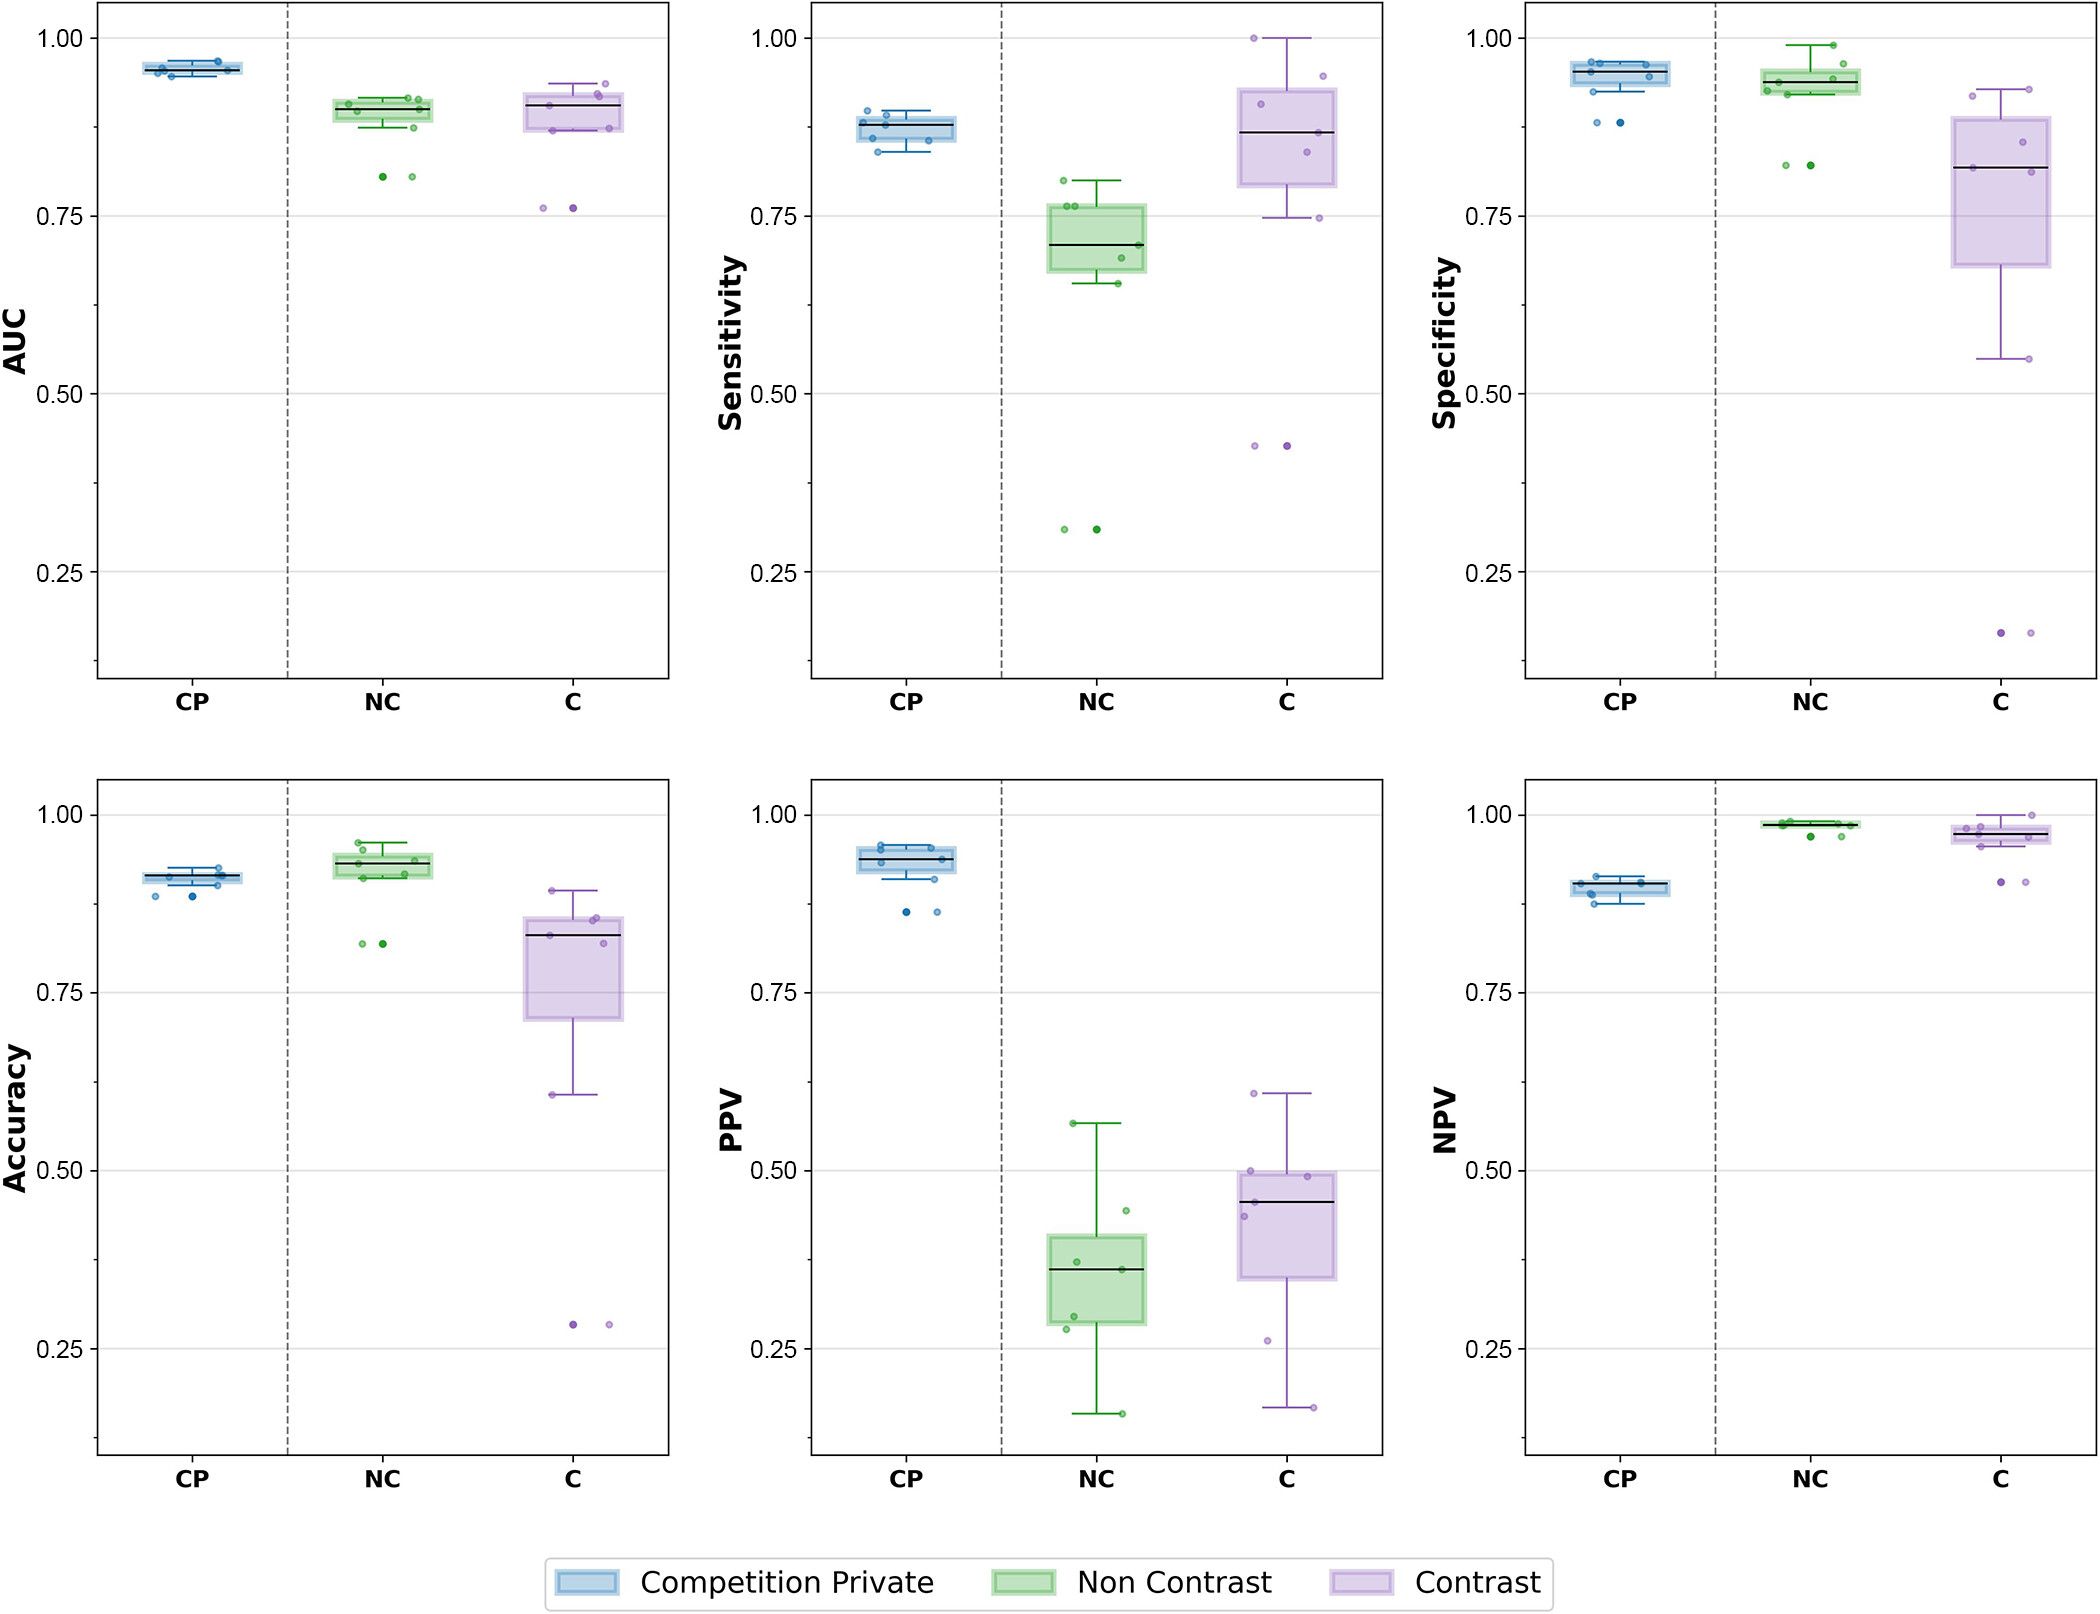
Figure 3: Box and whisker plots showcase the distribution of performance metrics for binary classification by the winning algorithms on different datasets. The metrics are the area under the receiver operating characteristic curve (AUC), sensitivity, specificity, accuracy, positive predictive value (PPV), and negative predictive value (NPV). Performance is displayed across the competition private dataset (CP), actual prevalence noncontrast (NC), and actual prevalence contrast (C) datasets. The box represents the IQR, the median is indicated by the black line within the box, and the whiskers show the full range excluding outliers, which are depicted as individual points. Data points are also shown as jitters for clarity.
Competition Private Test Dataset
On the competition private test dataset, the seven top-scoring models had a mean AUC of 0.96 (range: 0.95–0.97), with a mean accuracy of 91.0% (range: 88.6%–92.6%). The mean sensitivity was 87.2% (range: 84.0%–89.8%), the mean specificity was 94.3% (range: 88.1%–96.7%), the mean positive predictive value was 93.0% (range: 86.4%–95.8%), and the mean negative predictive value was 89.7% (range: 87.5%–91.4%). Detailed individual model performances for the competition dataset are shown in Table 2 .

Noncontrast and Contrast-enhanced CT Clinical Test Datasets
On the clinical test dataset, the models showed reduced AUC and accuracy on both subsets of the dataset. Specifically, accuracy was reduced in the contrast-enhanced dataset but remained high for the noncontrast subset. Due to the lower prevalence, model performances on both the noncontrast and contrast-enhanced datasets were characterized by a high negative predictive value (mean, 98.5% and 96.7%, respectively) and a notable decrease in positive predictive value (mean, 35.3% and 41.7%, respectively) compared with the competition dataset. In the noncontrast dataset with a real-world prevalence of 4.2%, the mean AUC across models was 0.89 (range: 0.79–0.92), mean accuracy was 91.8% (range: 81.9%–96.1%), mean sensitivity was 67.0% (range: 30.9%–80.0%), and mean specificity was 92.9% (range: 82.1%–99.0%). In the contrast-enhanced dataset with a real-world prevalence of 14.5%, the mean AUC across models was 0.88 (range: 0.76–0.94); mean accuracy was 73.5% (range: 28.4%–89.4%); mean sensitivity was 81.9% (range: 42.7%–100.0%); and mean specificity was 72.1% (range: 16.4%–92.8%). Individual model performance on the clinical test set is presented in Table 3 and Table 4 for noncontrast and contrast datasets, respectively.
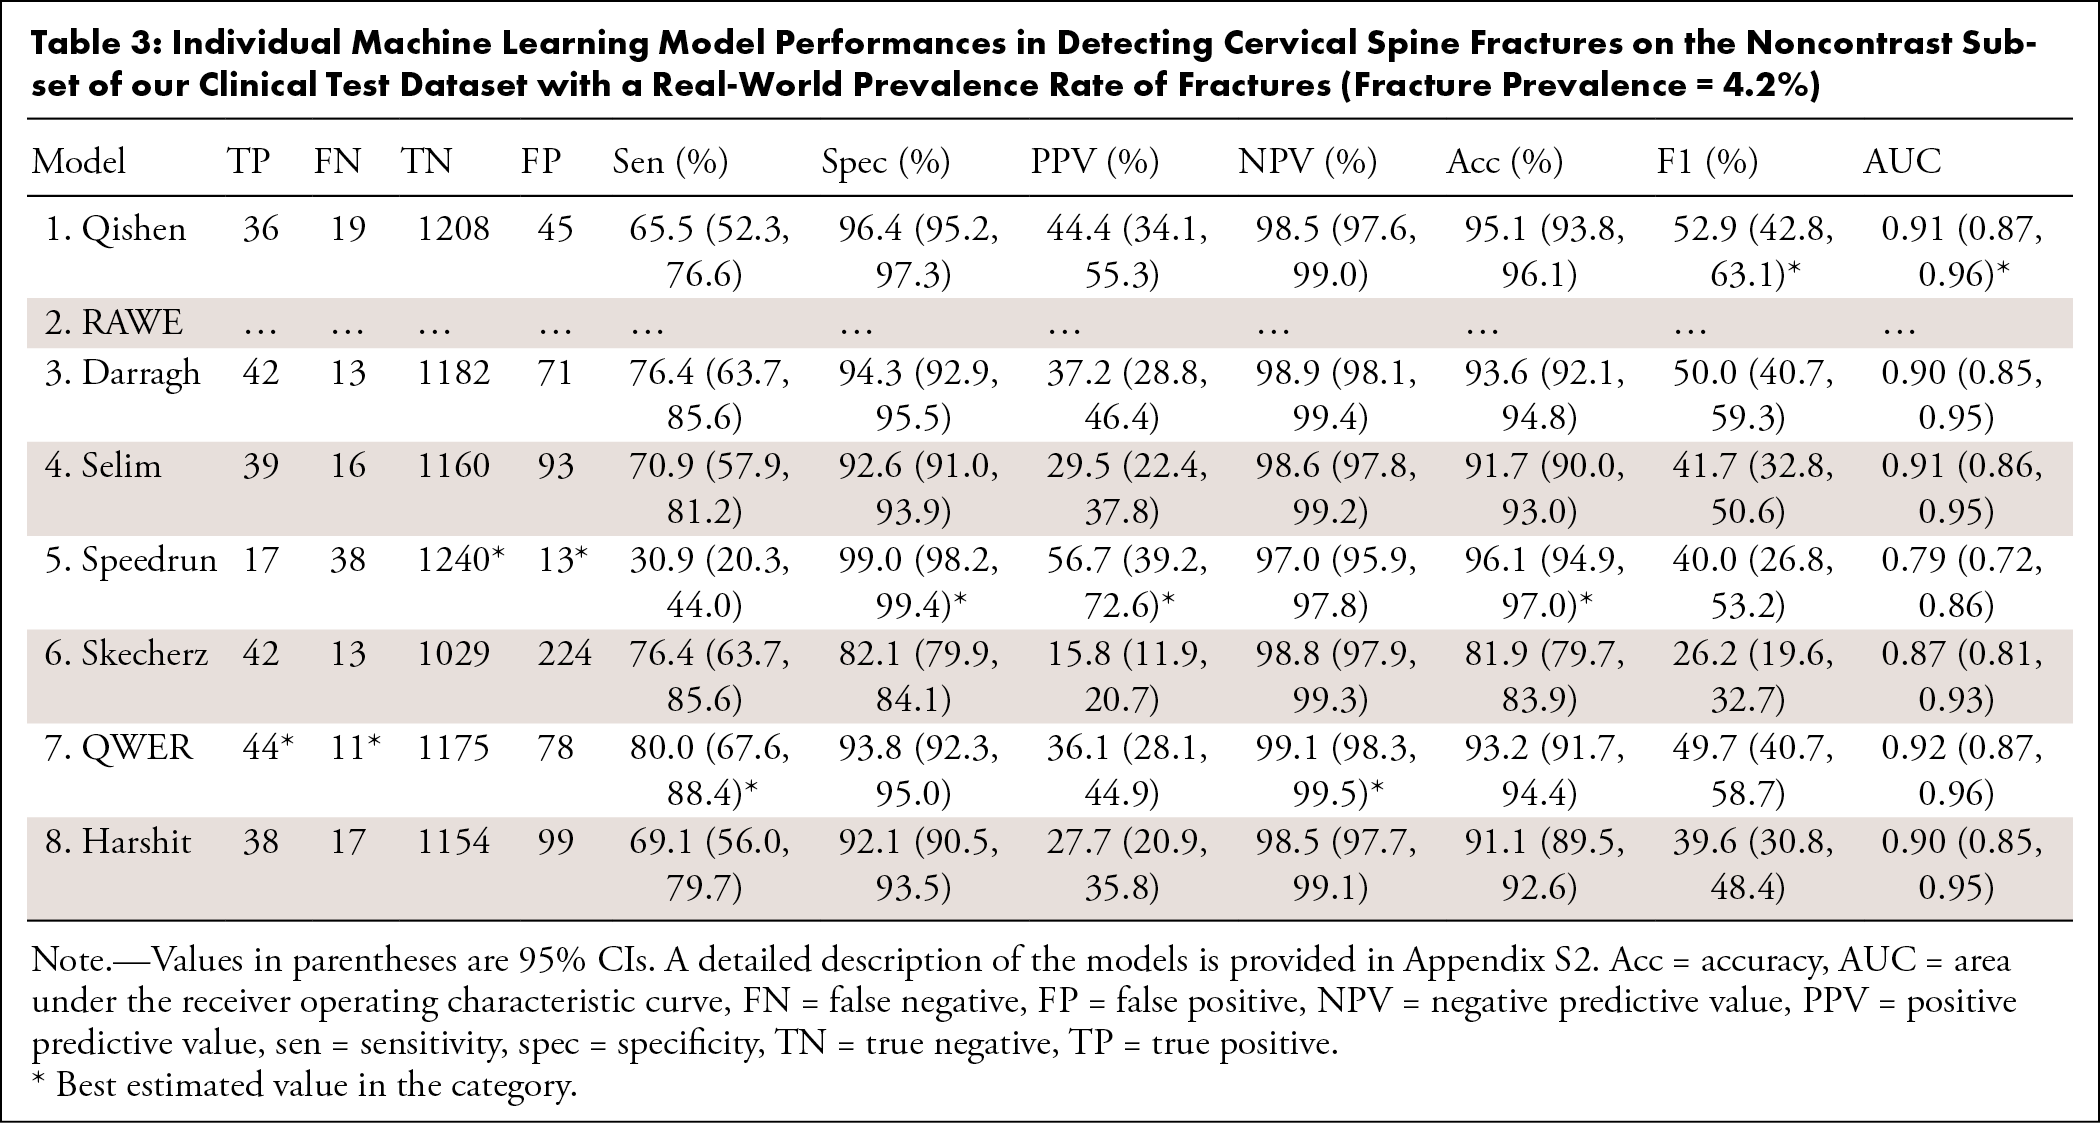
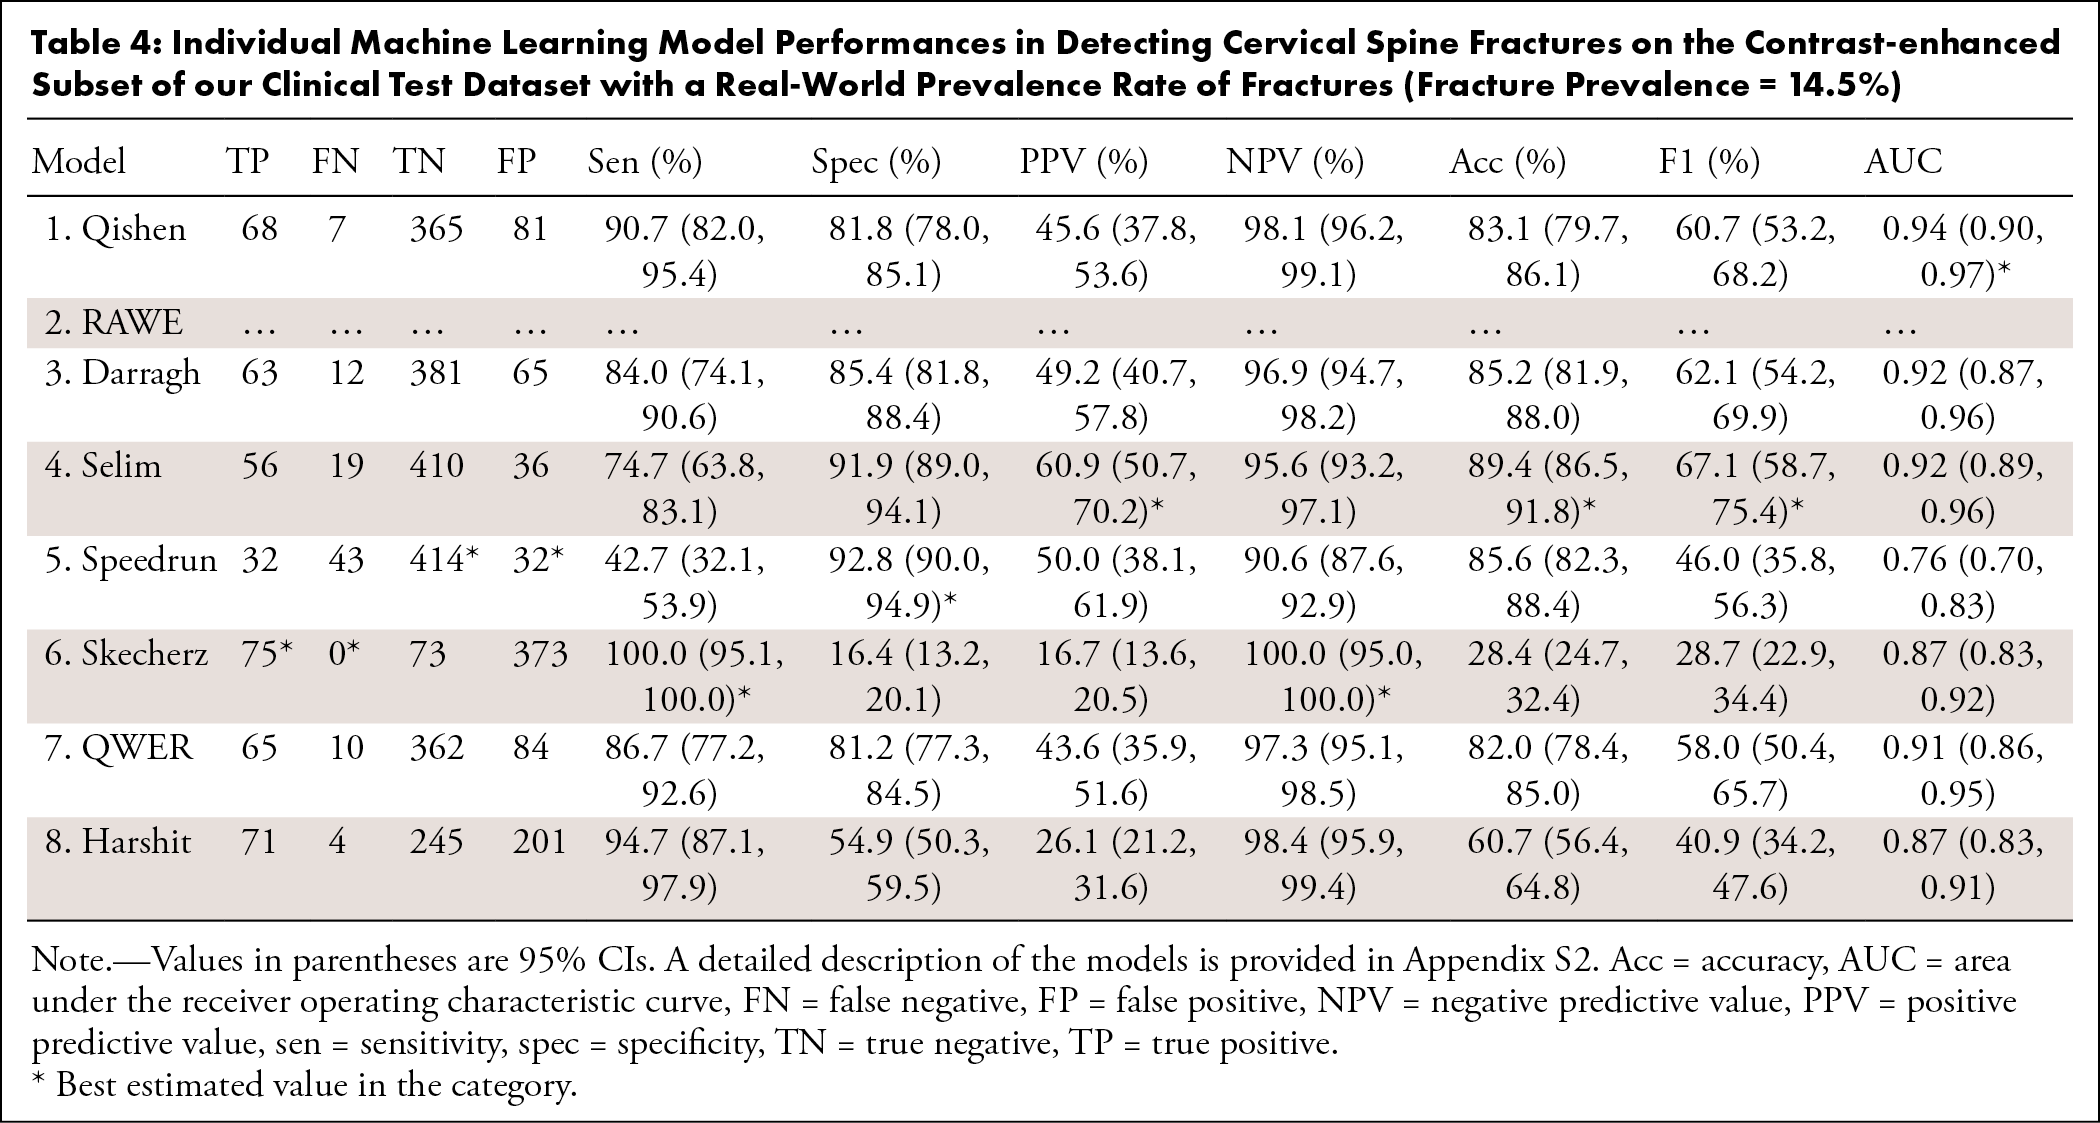
Table 4: Individual Machine Learning Model Performances in Detecting Cervical Spine Fractures on the Contrast-enhanced Subset of our Clinical Test Dataset with a Real-World Prevalence Rate of Fractures (Fracture Prevalence = 14.5%)
Analysis of False-Positive and False-Negative Scans
There were 116 false-positive (47 noncontrast, 69 contrast-enhanced) and 78 false-negative (35 noncontrast, 43 contrast-enhanced) scans. On review, the ML models correctly identified 10 cases of true fractures that were initially missed by reporting radiologists ( Fig 4 ). The most common influential regions identified on Grad-CAM heat maps for false-positive cases were vessels, present in 43 of 116 (37.1%) false-positive cases and in 39 of 69 (56.5%) false-positive contrast-enhanced studies. Other less-common influential regions contributing to false-positive cases were related to chronic changes such as osteophytes, degenerative cortical irregularities, ligament and soft tissue calcification, vascular channels, and artifacts ( Fig 5 ).
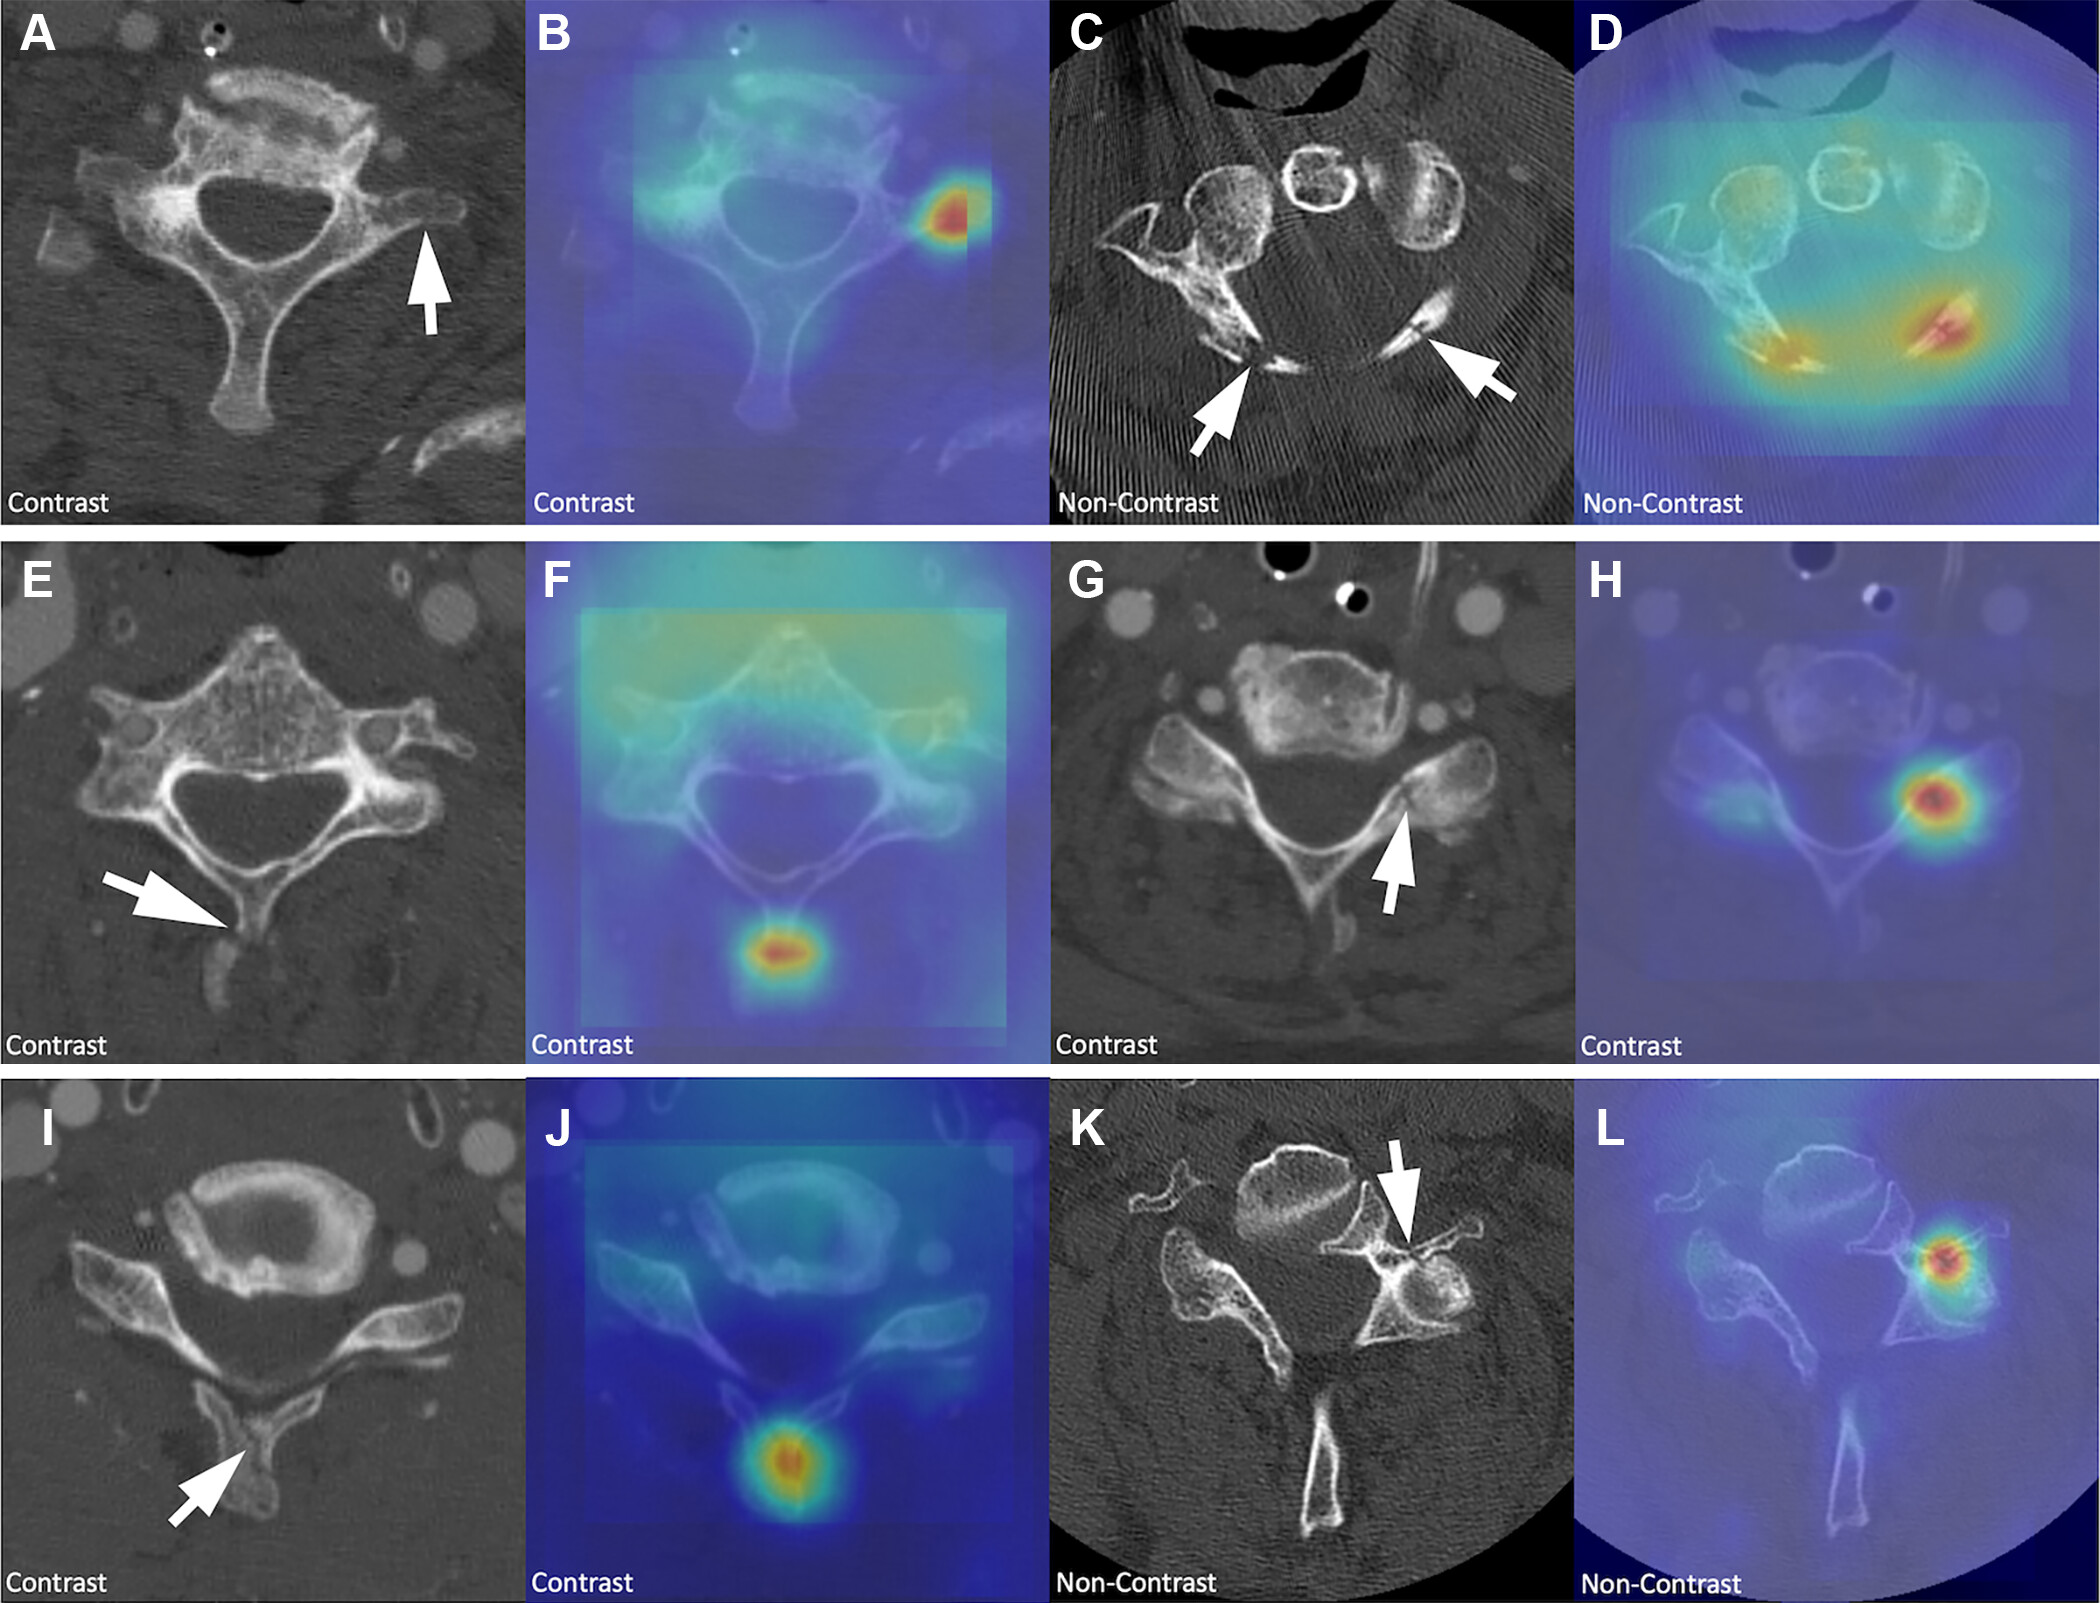
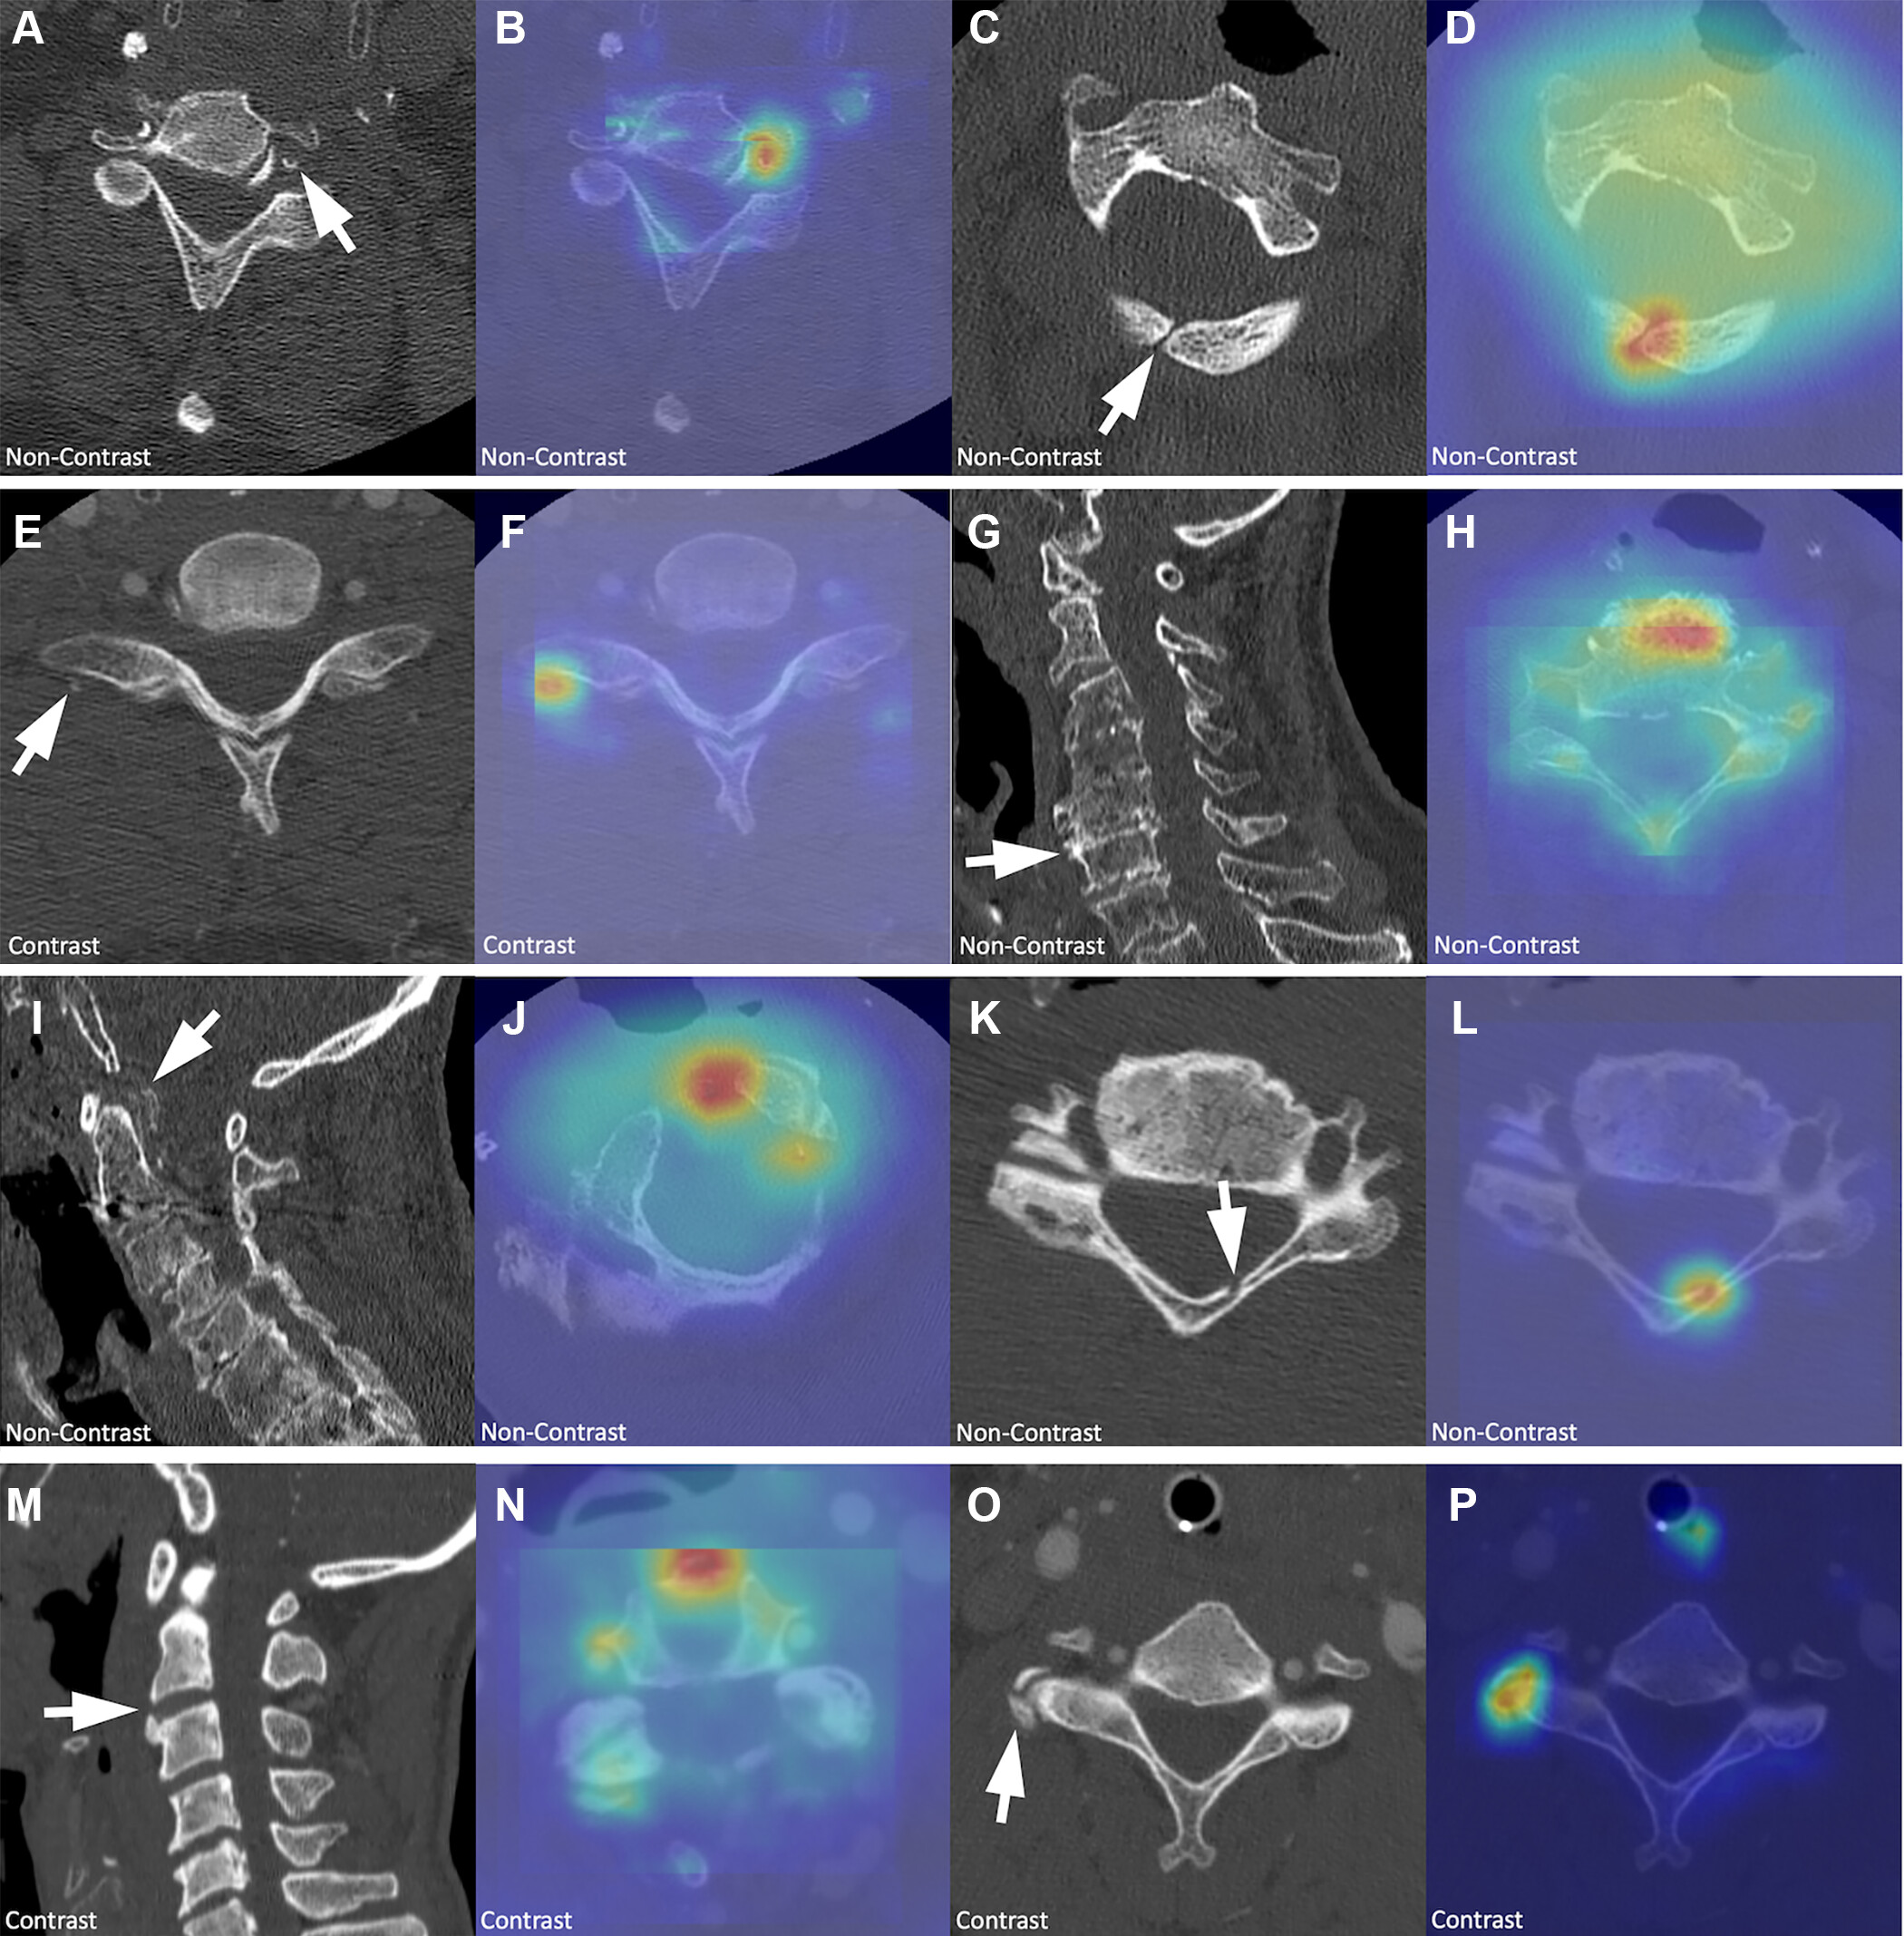
Figure 5: Example cases in the false-positive group incorrectly identified as fractures by the machine learning models. The CT images with associated gradient-weighted class activation heat maps show the most influential regions in the input image for the prediction. Warmer colors (eg, red) on the heat map indicate areas the model focuses on more intensely, with brighter colors signifying higher influence on the model’s decision. The presence of contrast material at CT imaging is labeled in the bottom left corner of each image. CT images in G, I , and M are presented in the sagittal plane to better demonstrate pathology; all other images are in the axial plane. (A, B) Calcified atherosclerotic plaque in the left vertebral artery in the left transverse foramen (arrow in A ). (C, D) Congenital lack of fusion of the posterior arch of C1 (arrow in C ). (E, F) Contrast material within a small vessel in the right paraspinal region (arrow in E ). (G, H) Chronic multilevel degenerative changes with reduced intervertebral disk spaces, osteophyte formation (arrow in G ), and osteopenia. (I, J) Partially calcified pseudomass (arrow in I ) posterior to the odontoid process of C2, secondary to calcium pyrophosphate dihydrate crystal deposition disease. (K, L) Nutrient vessel within the left lamina (arrow in K ). (M, N) Chronic osteophyte arising from the superior-anterior vertebral body of C3 (arrow in M ). (O, P) Chronic osteophytic changes associated with the right articular process (arrow in O ).
On review of the false-negative cases for the seven ML models, there were 135 fractures across 78 scans (42 contrast-enhanced and 36 noncontrast). There were two cases in which no definite fracture was identified, and these were reclassified as true-negative cases. In cases of fracture, there were 88 underlying factors in the region of injury, possibly contributing to missed detection by the ML models. The most common were chronic and degenerative changes (53 of 88), followed by osteopenia (23 of 88), artifact (eight of 88), healed chronic fracture (two of 88), and osseous lesions associated with pathologic fracture (two of 88). The most common sites of missed fractures were at the edge of the vertebral body end plate (36 of 135), transverse process (35 of 135), and spinous process (17 of 135). The most common levels of missed fractures were at C7 (19.3%; 26 of 135) followed by C6 (17.8%; 24 of 135).
Discussion
Award-winning models from the 2022 RSNA competition demonstrated strong performance with a mean AUC of 0.96 and accuracy of 91.0% on the competition test dataset and a mean AUC of 0.89 and accuracy of 91.8% for noncontrast scans and a mean AUC of 0.88 and accuracy of 73.5% for contrast-enhanced scans on the clinical test dataset. The major strength of this study is that every cervical spine CT scan performed in adults for a traumatic indication in the emergency department over a 1-year period was included in this study without exclusion criteria. Importantly, both contrast-enhanced and noncontrast CT scans were included in this dataset, as both are routinely encountered in clinical practice, despite models being trained solely only on noncontrast scans. Although the competition dataset used real-world data collected from multiple institutions, the data underwent filtration during curation to help optimize it for competition purposes, which may not accurately reflect the clinical setting. Our dataset provides a more genuine representation of data encountered in a real-world clinical environment and was analyzed in balanced and unbalanced groups, reflecting the matched higher prevalence of fractures in the competition test dataset and the lower prevalence of fractures encountered in clinical practice.
Previous studies exploring ML models for cervical spine fracture detection have shown varied performance. Zhang et al 31 reported an AUC up to 0.87, Salehinejad et al 32 achieved a classification accuracy of 71%–79%, and Golla et al 33 reached 87% sensitivity at the fracture level. BriefCase, a U.S. Food and Drug Administration–approved tool, demonstrated a sensitivity of 91.7% and specificity of 88.6% in its regulatory submission 34. However, external testing by Small et al 35 and Voter et al 36 reported lower sensitivities of 76% and 54.9%, respectively. Our results suggest that the top-performing ML models developed by participating teams for the RSNA competition have been able to achieve better model performance than the previously reported results from individual research groups. Although the models evaluated still do not match radiologist metrics, with the sensitivity and specificity of radiologists to detect cervical spine fractures at CT shown to be 88.0%–93.0% and 96.0%–99.0%, respectively 35,37, these models hold promise as rapid auxiliary tools. In fact, our study showed that a small number of fractures missed by radiologists were retrospectively identified by the ML models. The models generated a cervical spine fracture prediction in just 10–30 seconds, while typically, it takes between 33 to 43 minutes from scan acquisition until a finalized report by radiologists 35. Therefore, ML models could be used as rapid triaging tools to flag the study to alert the radiologist of a possible fracture, some of which may be missed by radiologists.
In examining the performance metrics, it was noted that the models faced challenges when applied to the clinical test dataset, particularly with contrast-enhanced scans. Higher performance in the noncontrast subset is expected given that the training dataset consists of these exclusively. Average model sensitivity reductions were 20.2% for noncontrast scans and 5.2% for contrast-enhanced scans, while average specificity reductions were 1.4% for noncontrast scans and 22.2% for contrast-enhanced scans. Interestingly, accuracy for noncontrast scans slightly improved, with an average increase of 0.7%, whereas contrast-enhanced scans experienced an accuracy decline of 17.5%, both attributed to differences in fracture prevalence. These results underscore the broader challenge of transitioning from curated datasets to real-world clinical applications, as highlighted by external testing studies by Voter et al and Small et al, where sensitivity decreased from 91.7% to as low as 54.9% 35,36. Our study also revealed areas of strength and improvement for the models, through a comprehensive review of the false-negative and false-positive cases. Intravascular contrast material, chronic changes, osseous channels, and artifacts can lead to falsely labeling studies as positive for fracture. For example, small opacified vessels closely related to the cervical spine can mimic the appearance of a fracture fragment. In the false-negative cases, certain types of fractures were missed most by the models, including fractures at the edge of the vertebral body end plate, transverse process, and spinous process locations, consistent with previous research 35,36. The most common cause for models to miss fractures were degenerative changes and osteopenia, also observed by Small et al 35, leading to underperformance in older patients 36. An understanding of these patterns can guide future model refinement by inclusion of greater numbers of imaging studies with underrepresented pathologies.
This study had limitations. The use of clinical data from a single center may limit the generalizability of our findings. Additionally, the training data were exclusively noncontrast CT scans focusing on acute fractures, which may not represent the complexity of cases in the clinical test dataset that included patients with previous surgical interventions and contrast-enhanced studies; therefore, models could underperform on our dataset. Last, although Grad-CAM was used for model transparency, its limitations in localizing multiple instances and capturing fine details, as noted by Mohamed et al 38, might have influenced the interpretability of our results, although major issues were not observed in this study. Future model enhancements will involve training on a more diverse array of scans and integrating feedback from real-world applications to boost accuracy and reliability in clinical settings.
In conclusion, evaluation of the top-performing ML models in the 2022 RSNA competition on a clinical test dataset demonstrated that the models fell short of their performance on the competition dataset. However, the models still performed favorably as compared with previously published cervical spine detection algorithms, including U.S. Food and Drug Administration–approved commercial models. The models showed potential to generalize to the analysis of contrast-enhanced scans and of patients with prior surgical intervention, despite being trained on a dataset that excluded these examinations. Addressing false-positive and false-negative cases through the inclusion of relevant imaging studies holds potential for future model refinement. These models may serve as valuable supplementary diagnostic tools for cervical spine fracture detection, emphasizing the necessity for ongoing improvement efforts and prospective evaluation of deployed models.