The RSNA Lumbar Degenerative Imaging Spine Classification (LumbarDISC) Dataset
Summary
The RSNA Lumbar Degenerative Imaging Spine Classification dataset is the largest publicly available adult MRI lumbar spine dataset for degenerative disease. The dataset includes multisequence, multiplanar MRI scans from 2697 patients through contributions from eight institutions across six countries and five continents.
Key points
- The RSNA Lumbar Degenerative Imaging Spine Classification dataset is the largest publicly available adult MRI lumbar spine dataset for degenerative disease, with contributions from eight institutions across six countries and five continents.
- The dataset consists of multisequence, multiplanar MRI scans and image level annotations, including localizers and disease severity grades, performed by volunteer neuroradiology and musculoskeletal radiologists from the American Society of Neuroradiology, American Society of Spine Radiology, and the Radiological Society of North America.
- This dataset was used for the Radiological Society of North America 2024 Lumbar Spine Degenerative Classification artificial intelligence challenge and is made freely available to the research community for noncommercial use.
Supplemental material is available for this article.
Introduction
Low back pain is a global health problem, with a reported lifetime prevalence of up to 84% 1. In the United States alone, the direct and indirect costs of low back pain are estimated at $50–$100 billion 2. In the lumbar spine, narrowing of the spinal canal, neural foramina, and subarticular recesses can compress spinal nerve roots, leading to radiculopathy and often necessitating spinal surgery. MRI is the preferred imaging modality to assess the degree of narrowing in these regions; however, interrater agreement on grading the severity of stenosis has varied widely across studies and spinal levels, ranging from poor to substantial 3,4. Although the large number of lumbar spine MRI scans represents a substantial workload for radiologists, the more critical challenge lies in ensuring consistent and accurate grading of stenosis severity, which impacts diagnostic confidence and potentially patient care. Previous efforts to develop machine learning models for this purpose have been limited by the availability and size of lumbar spondylosis imaging datasets 5–7. Our goal was to create the largest, most diverse, expertly annotated MRI lumbar spondylosis dataset for both the RSNA 2024 Lumbar Spine Degenerative Classification AI Challenge and future research.
Dataset Curation and Annotation
Figure 1 shows a flowchart of the RSNA Lumbar Degenerative Imaging Spine Classification (LumbarDISC) dataset curation and annotation process, with a detailed description provided in Appendix S1 . Briefly, imaging and demographic data were acquired from each contributing site as detailed in Appendix S2 . Inclusion criteria included an MRI lumbar spine study with sagittal “T2-like” (eg, conventional spin echo T2-weighted, short tau inversion recovery, or Dixon), sagittal T1-weighted, and axial T2-weighted images. Both axial T2-weighted images acquired as a continuous stack or oriented parallel to the intervertebral disk levels were acceptable if they included at least three lumbar spine disk levels. Additional inclusion criteria were patient age of at least 18 years old and imaging performed in an outpatient setting for lumbar degenerative disease. Exclusion criteria were lumbosacral spinal hardware, active nondegenerative pathology (eg, spinal tumor, active infection, etc), severe scoliosis, or substantial diagnostic limiting artifact. Examinations were evaluated for exclusion criteria during labeling of the L5-S1 intervertebral disk, during the annotation process, and as a quality assurance step after the annotation process was complete and flagged for removal if any of the exclusion criteria were present.
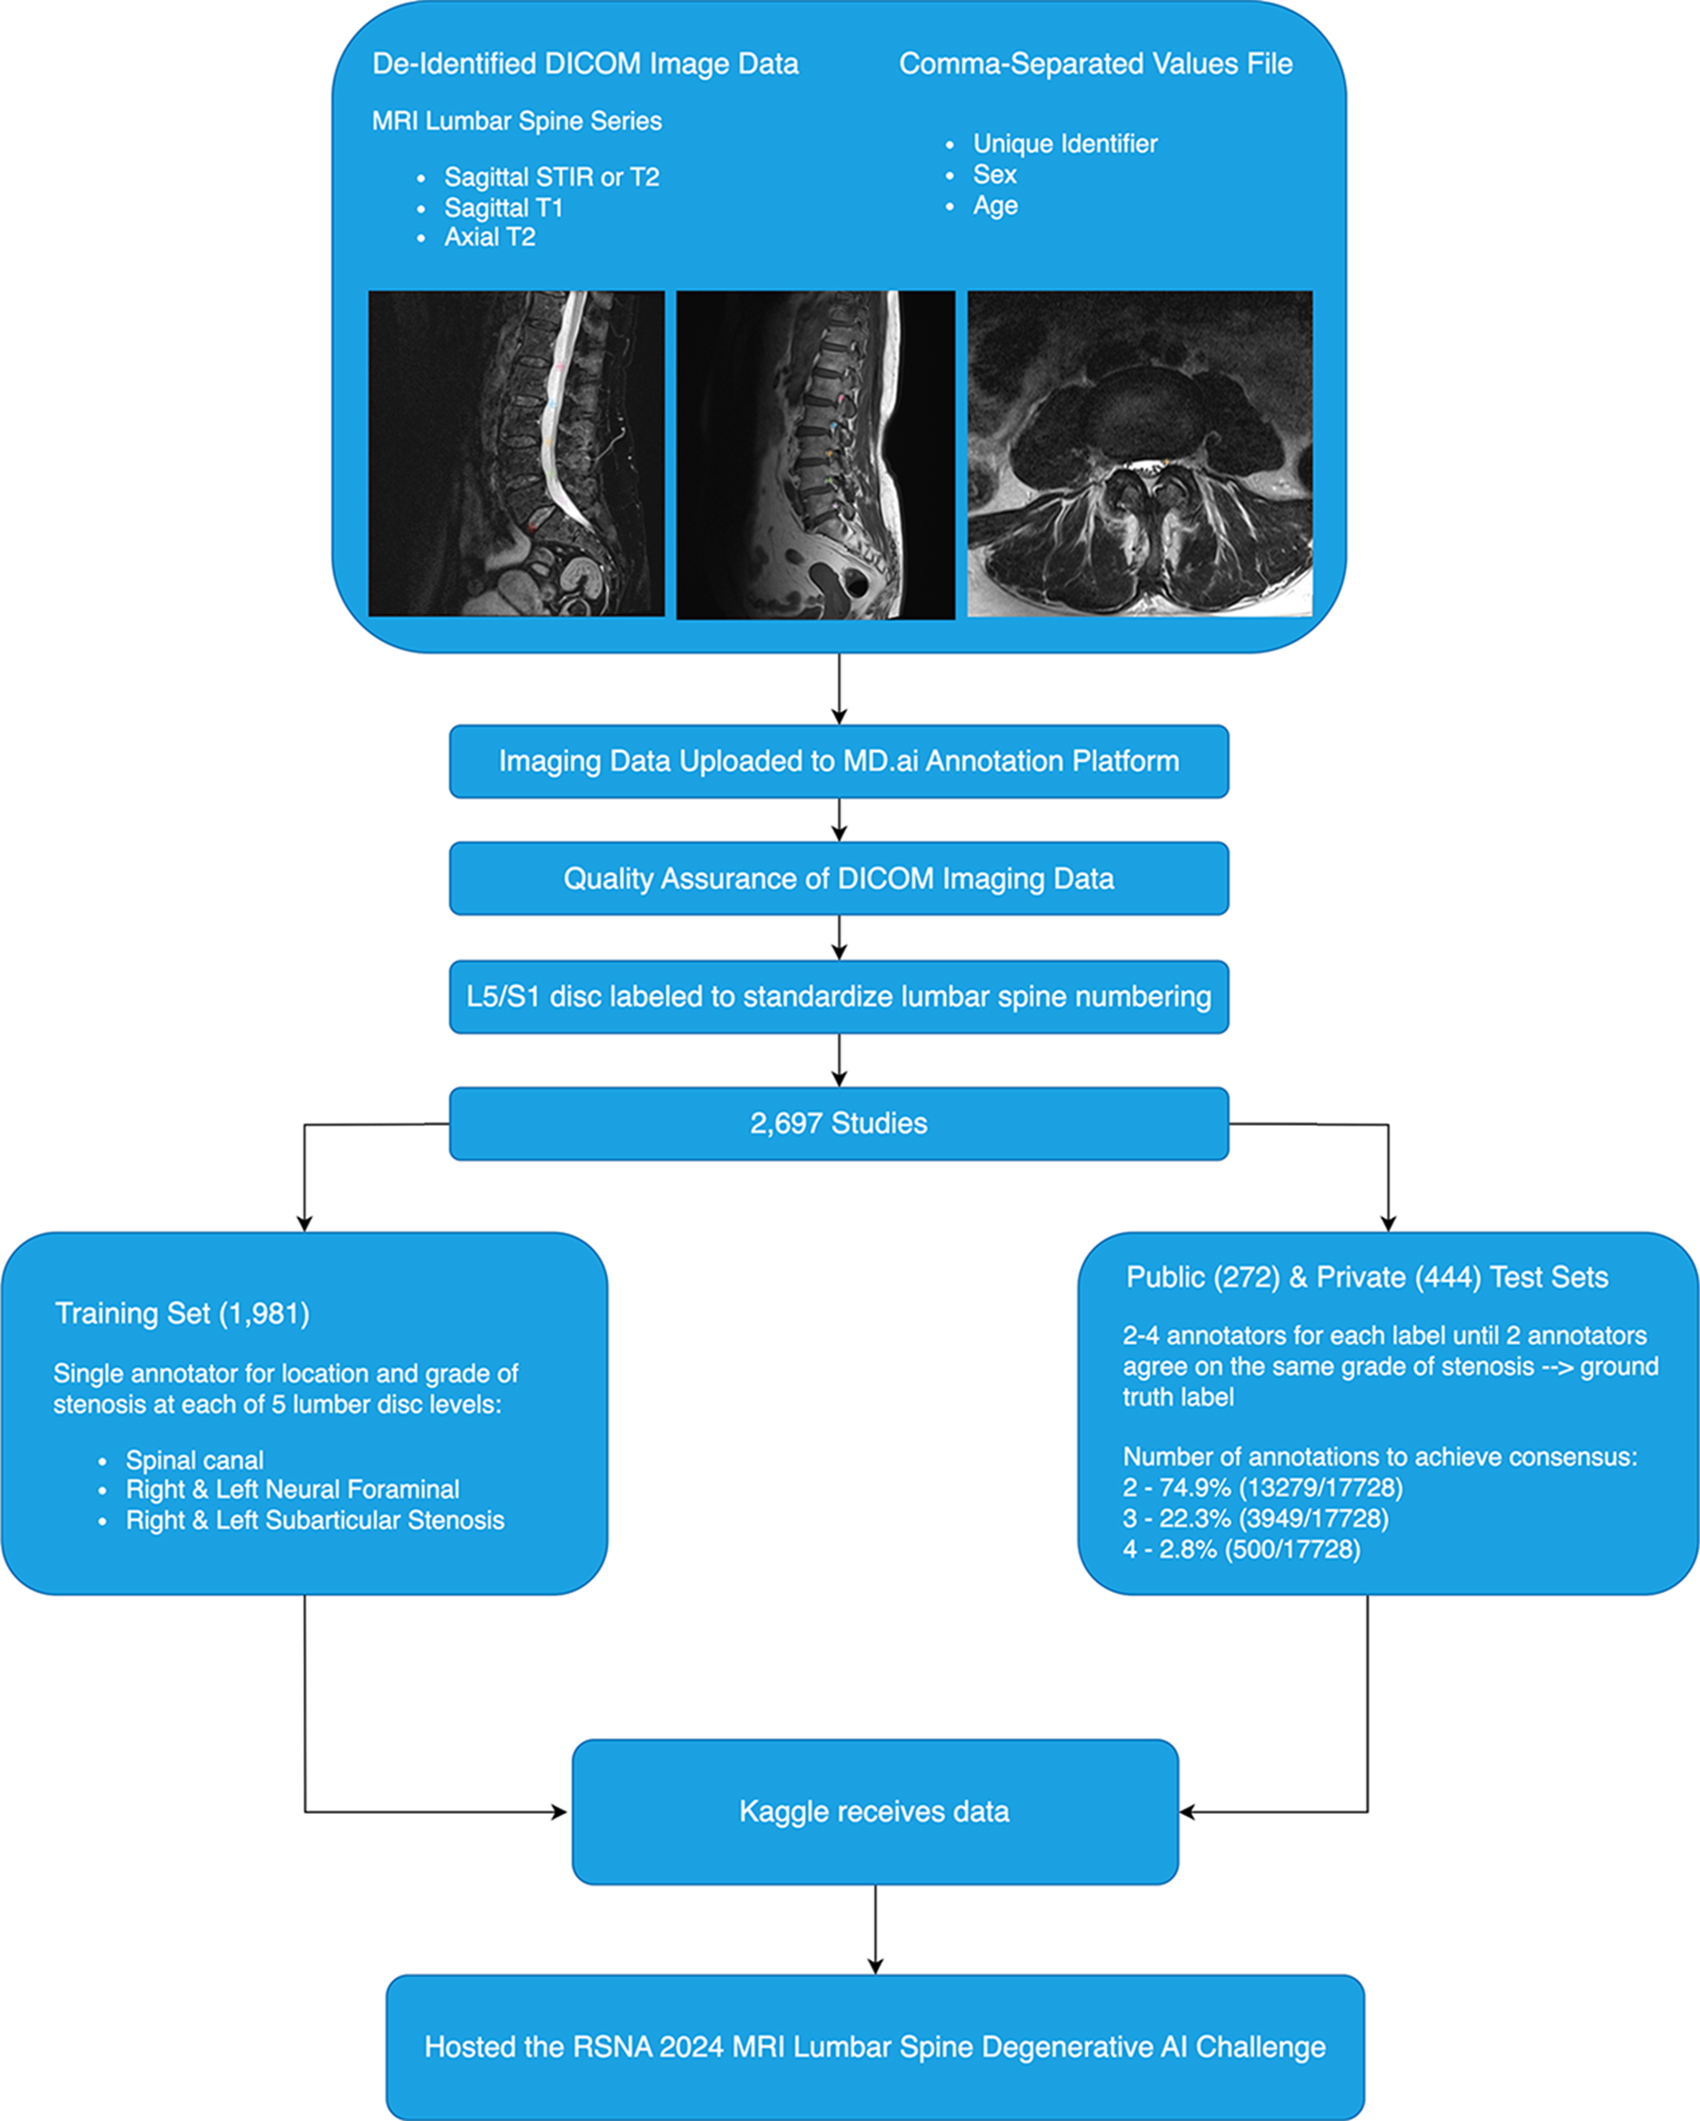
Figure 1: Flowchart shows a summary of the data acquisition, curation, and annotation process. AI = artificial intelligence, DICOM = Digital Imaging and Communications in Medicine, STIR = short tau inversion recovery.
Volunteer annotators from the RSNA, American Society of Neuroradiology, and the American Society of Spine Radiology graded the degree of stenosis (four-point scale of normal, mild, moderate, or severe) in the following five locations: spinal canal (labeled on the T2-like sequence), right and left neural foraminal (sagittal T1-weighted), and right and left subarticular recess (axial T2-weighted) ( Fig 2 ). A localizer was also placed for each annotation, centered at the spinal level corresponding to the assessed stenosis grade (eg, centered within the L1-L2 neural foramen for the stenosis grade at that level) (see Fig 2 ). Annotators were provided with an instruction manual ( Appendix S3 ) and a short instructional video to review. Each annotator was assigned to annotate one location (spinal canal, neural foramina, or subarticular stenosis) based on their performance for each location on a 10-case practice test. After all cases were annotated once, the four-point severity scale was collapsed into a three-point scale by combining normal and mild. From this, studies were divided into training ( n = 1981), public test ( n = 272), and private test ( n = 444) datasets. Emphasis was placed on optimally distributing the data with respect to sex, age, contributing site, and disease severity classes across the training, public test, and private test sets. A greater portion of the high-grade stenosis cases at L1-L2, L2-L3, and L5-S1 were distributed to the test sets to have adequate examples to evaluate the models at these naturally underrepresented levels. We also had three data-contributing sites (sites 2, 4, and 7) search their database to identify additional cases of high-grade disease at these levels. For the test datasets, an additional one to three annotations were acquired until two annotators agreed on a degree of severity, which established the consensus grade. See Figure 3 for severity distributions of high-grade stenosis by training and test sets and Appendix S1 for a more detailed description of the annotation process.
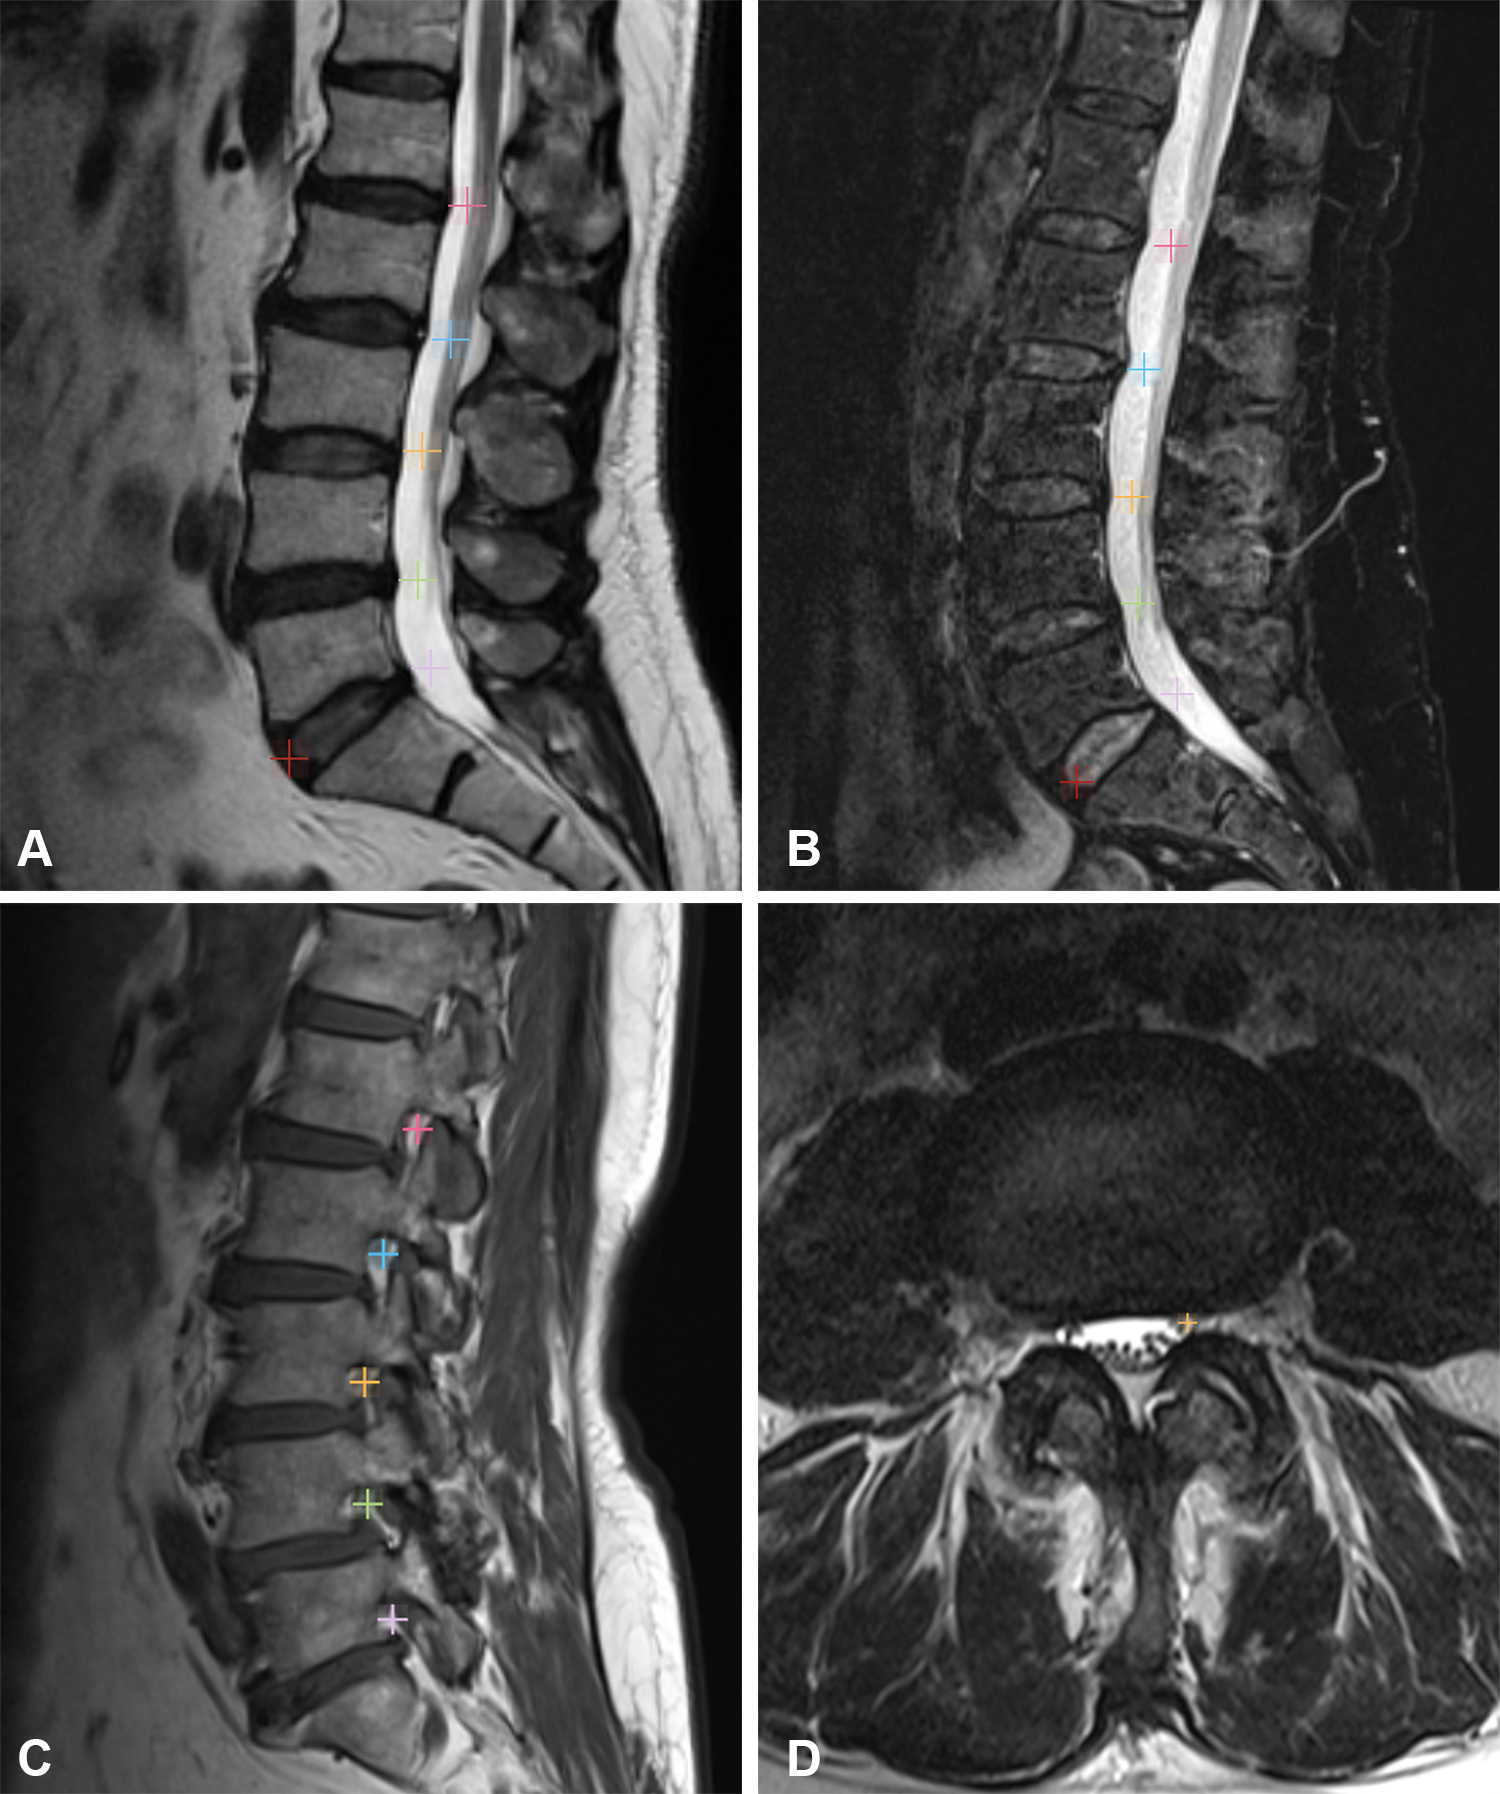
Figure 2: MR images in (A) sagittal T2-weighted and (B) sagittal STIR views demonstrate the location of the localizers within the middle of the thecal sac at the level of the L1-L2 through L5-S1 intervertebral disks. Pink localizers placed in the center of the spinal canal, neural foramen, or subartiuclar recess designate L1-L2 intervertebral disk level, blue designates the L2-L3 level, orange designates the L3-L4 level, green designates the L4-L5 level, and lavender designates the L5-S1 level. These images also include the red localizer to demarcate the L5-S1 intervertebral disk level at the anterior margin of the disk that was added to all images prior to annotation to allow for consistent spine numbering between annotators. MR images in (C) sagittal T1-weighted and (D) axial T2-weighted views demonstrate localizers centered within the left neural foramina and bilateral subarticular zones, respectively. STIR = short tau inversion recovery.
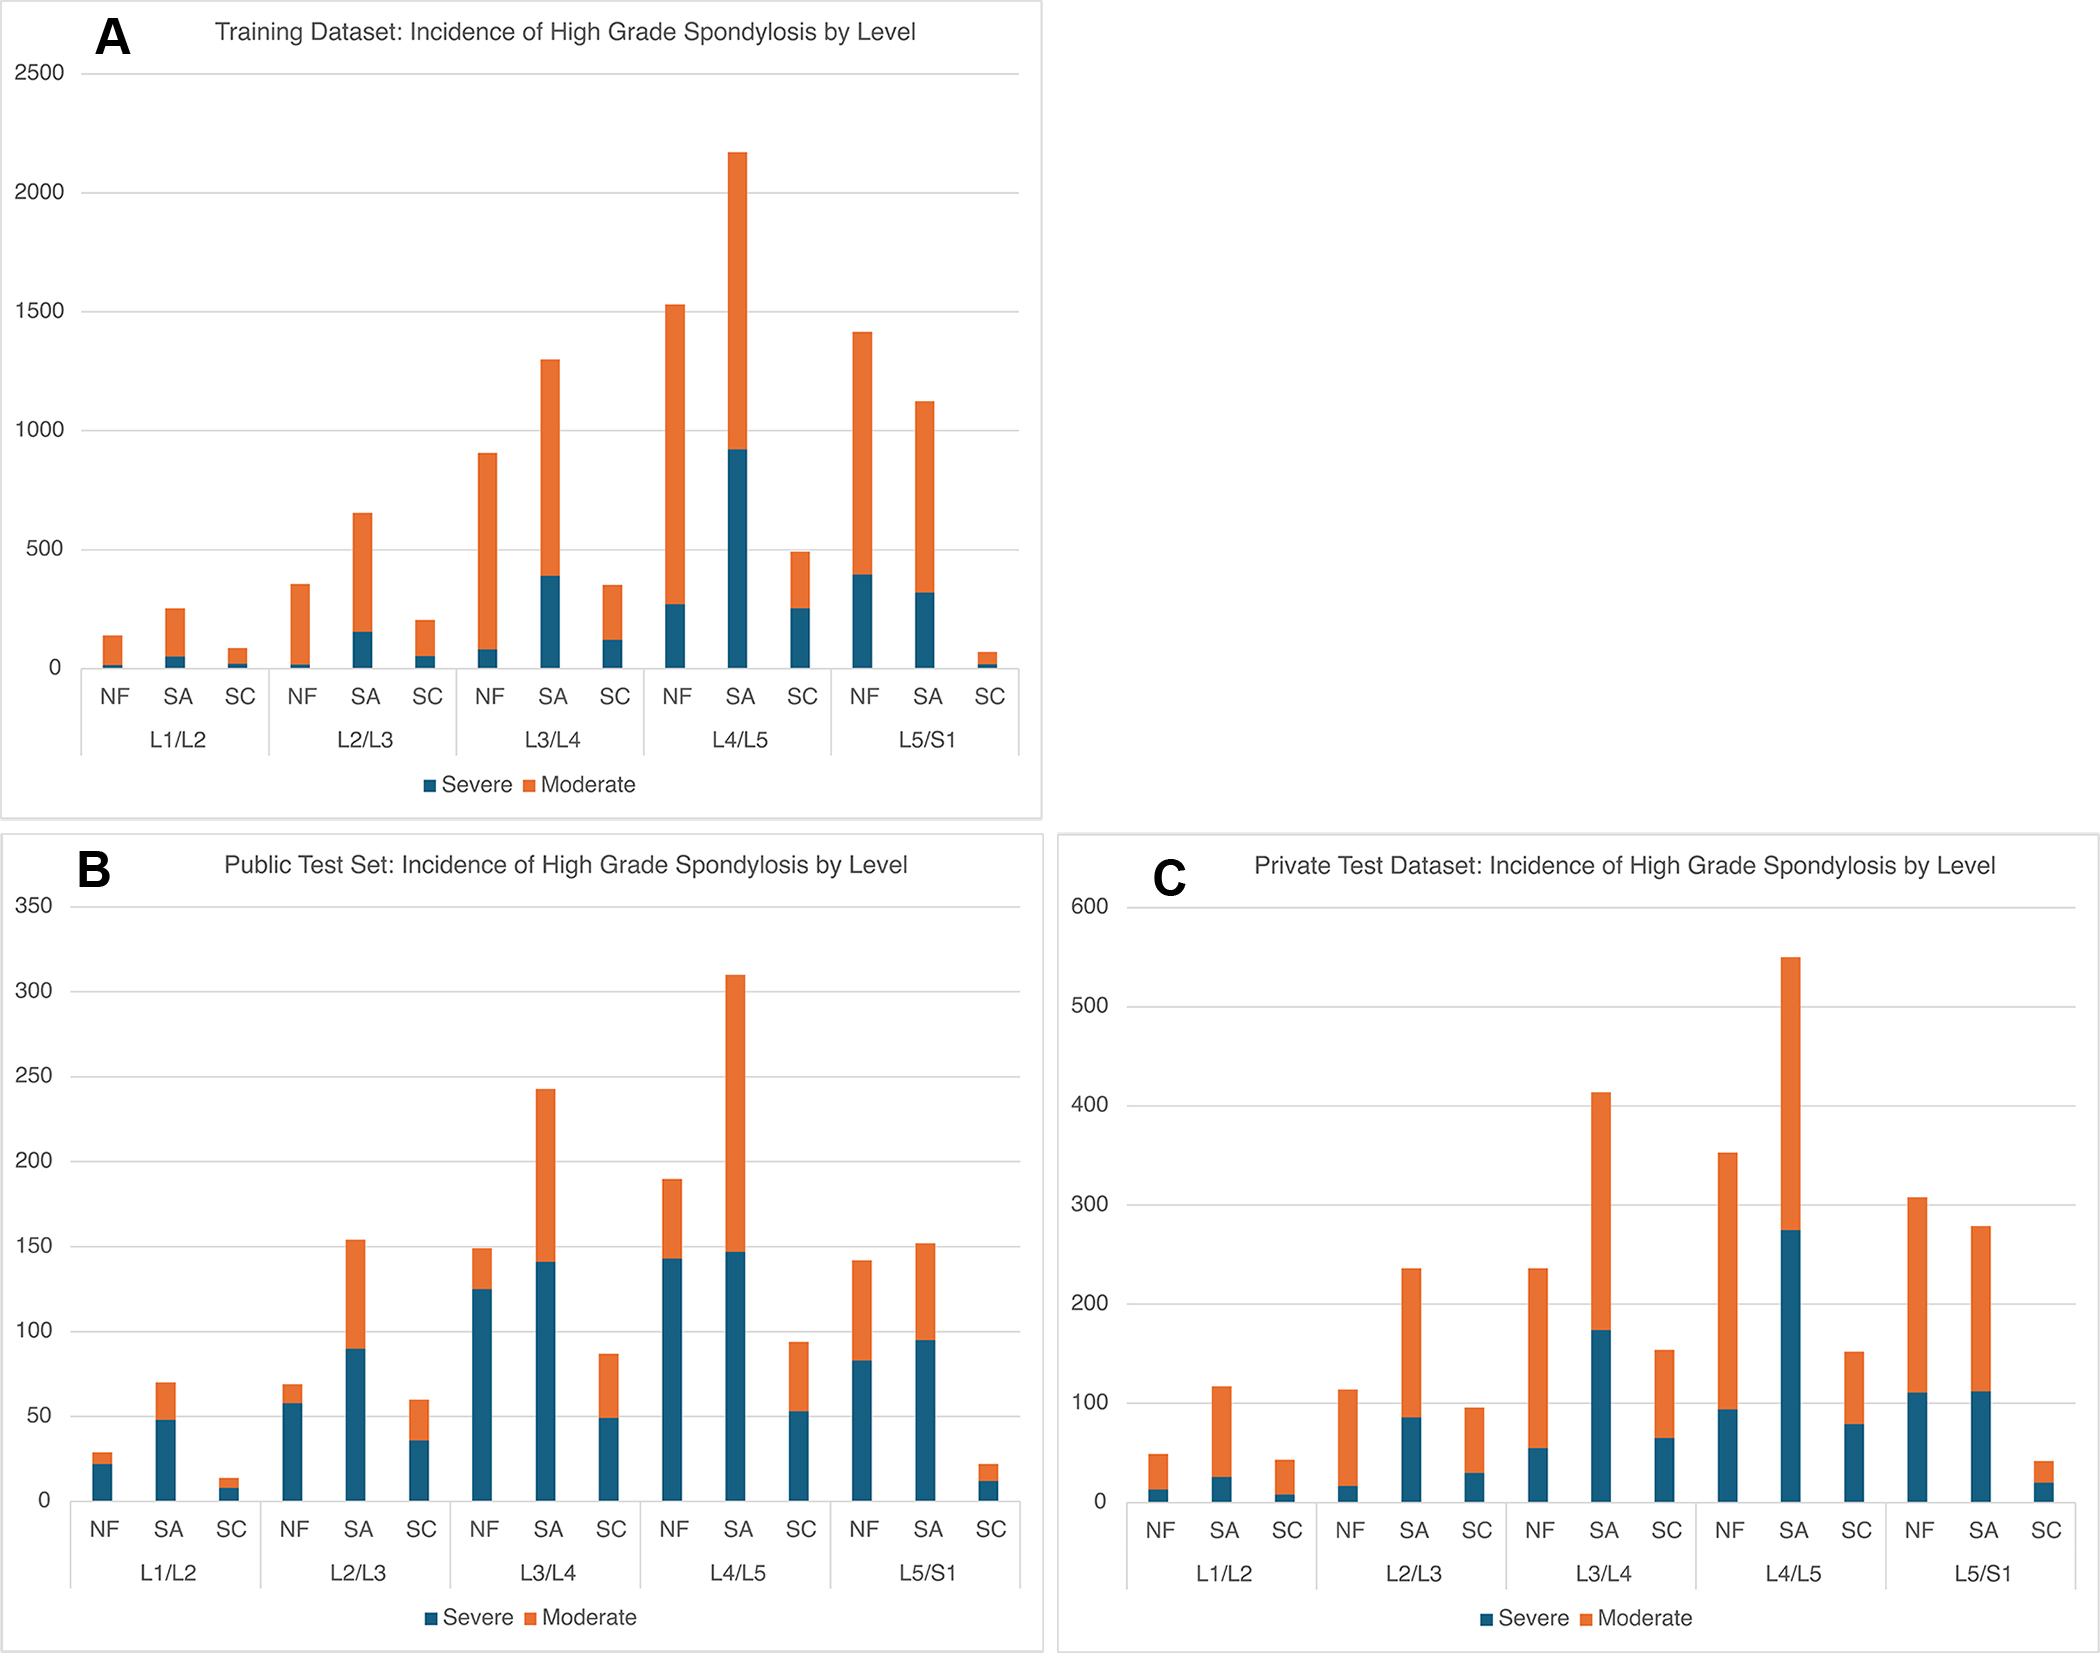
Figure 3: Bar graphs show the distribution of moderate and severe disease across the (A) training, (B) public test, and (C) private test sets. The y-axis represents the number of moderate and severe grades by level on either the right or left for neural foramina and subarticular recesses. NF = neural foramen, SC = spinal canal, SR = subarticular recess.
Dataset Description and Usage
The RSNA LumbarDISC dataset is composed of MRI studies of the lumbar spine from 2697 patients with a total of 8593 image series from eight institutions across six countries and five continents. Table 1 shows a summary of the patient demographics and incidence of high-grade (moderate or severe) degenerative stenosis by institution. Overall, of the 13 474 spinal canal stenosis grades, 11 502 of 13 474 (85.4%) were normal or mild, 1180 of 13 474 (8.8%) were moderate, and 792 of 13 474 (5.9%) were severe. Of the 26 919 neural foraminal grades, 10 521 of 13 444 (78.3%) right and 10 408 of 13 475 (77.2%) left were normal or mild, 2328 of 13 444 (17.3%) right and 2444 of 13 475 (18.1%) left were moderate, and 595 of 13 444 (4.4%) right and 623 of 13 475 (4.6%) left were severe. Of the 26 285 subarticular grades, 9130 of 13 151 (69.4%) right and 9124 of 13 134 (69.5%) left were normal or mild, 2581 of 13 151 (19.6%) right and 2528 of 13 134 (19.2%) left were moderate, and 1440 of 13 151 (10.9%) right and 1482 of 13 134 (11.3%) left were severe. Distribution of high-grade degenerative stenosis across contributing institutions and dataset partitions (training, private, and public test sets) are provided in Tables 1 and 2 . Regarding MRI scanners, the most common manufacturers were Siemens Healthineers (1791 of 2697 [66.4%]) and GE HealthCare (623 of 2697 [23.1%]), and the most common magnetic field strengths were 1.5 T (1714 of 2697 [63.6%]) and 3 T (920 of 2697 [34.1%]). See Table S1 for full details of MRI scanner magnetic strengths and manufacturers.
Table 1: Patient Demographics and Prevalence of Moderate and Severe Disease across the Contributing Institutions
| Site | No. of Patients of Each Sex | Age (y) | Total Cases | At Least Moderate Narrowing | Severe Narrowing | |||||||
|---|---|---|---|---|---|---|---|---|---|---|---|---|
| Male | Female | Neural Foramen | Subarticular | Spinal Canal | Any Location | Neural Foramen | Subarticular | Spinal Canal | Any Location | |||
| 1 | 99 | 135 | 55.8 ± 10.9 (22–82) | 234 | 197/234 (84.1) | 224/234 (95.7) | 137/234 (58.5) | 232/234 (99.1) | 61/234 (26.0) | 157/234 (67.0) | 66/234 (28.2) | 170/234 (72.6) |
| 2 | 432 | 199 | 64.3 ± 15.7 (18–89) | 631 | 520/631 (82.4) | 564/631 (89.3) | 349/631 (55.3) | 594 (94.1) | 244/631 (38.6) | 368/631 (58.3) | 206/631 (32.6) | 435/631 (68.9) |
| 3 | 110 | 163 | 48.4 ± 14.7 (20–89) | 273 | 144/273 (52.7) | 153/273 (56.0) | 27/273 (9.89) | 193/273 (70.6) | 29/273 (10.6) | 51/273 (18.6) | 9/273 (3.29) | 71/273 (26.0) |
| 4 | 219 | 173 | 62.6 ± 15.3 (19–89) | 392 | 321/392 (81.8) | 348/392 (88.7) | 230/392 (58.6) | 368/392 (93.8) | 163/392 (41.5) | 221/392 (56.3) | 131/392 (33.4) | 264/392 (67.3) |
| 5 | 160 | 235 | 56.6 ± 14.1 (19–89) | 395 | 290/395 (73.4) | 320/395 (81.0) | 167/395 (42.2) | 352/395 (89.1) | 124/395 (31.3) | 211/395 (53.4) | 95/395 (24.0) | 240/395 (60.7) |
| 6 | 188 | 208 | 47.7 ± 15.1 (18–85) | 396 | 190/396 (47.9) | 227/396 (57.3) | 40/396 (10.1) | 283/396 (71.4) | 35/396 (8.83) | 69/396 (17.4) | 11/396 (2.77) | 89/396 (22.4) |
| 7 | 42 | 52 | 59.7 ± 14.0 (20–89) | 94 | 61/94 (64.8) | 72/94 (76.5) | 51/94 (54.2) | 77/94 (81.9) | 56/94 (59.5) | 46/94 (48.9) | 25/94 (26.5) | 55/94 (58.5) |
| 8 | 131 | 151 | 56.2 ± 15.2 (18–86) | 282 | 199/282 (70.5) | 228/282 (80.8) | 111/282 (39.3) | 251/282 (89.0) | 75/282 (26.5) | 123/282 (43.6) | 61/282 (21.6) | 153/282 (54.2) |
| Total | 1381 | 1316 | 57.1 ± 16.0 (18–89) | 2697 | 1922/2697 (71.2) | 2136/2697 (79.1) | 1112/2697 (41.2) | 2350/2697 (87.1) | 761/2697 (28.2) | 1246/2697 (46.1) | 604/2697 (22.3) | 1477/2697 (54.7) |
Table 2: Patient Demographics and Prevalence of Moderate and Severe Disease across the Training, Public Test, and Private Test Sets
| Usage | No. of Patients of Each Sex | Age (y) | Total Cases | At Least Moderate Narrowing | Severe Narrowing | |||||||
|---|---|---|---|---|---|---|---|---|---|---|---|---|
| Male | Female | NF | SA | SC | Any | NF | SA | SC | Any | |||
| Training | 989 | 992 | 57.5 ± 15.1 (18–89) | 1981 | 1422/1981 (71.7) | 1548/1981 (78.1) | 71/19812 (35.9) | 1726/1981 (87.1) | 502/1981 (25.3) | 822/1981 (41.4) | 365/1981 (18.4) | 982/1981 (49.5) |
| Public Test | 144 | 128 | 56.4 ± 18.9 (18–89) | 272 | 170/272 (62.5) | 206/272 (75.7) | 135/272 (49.6) | 221/272 (81.2) | 81/272 (29.7) | 137/272 (50.3) | 84/272 (30.8) | 148/272 (54.4) |
| Private Test | 248 | 196 | 56.2 ± 17.7 (18–89) | 444 | 330/444 (74.3) | 382/444 (86.0) | 265/444 (59.6) | 403/444 (90.7) | 178/444 (40.0) | 287/444 (64.6) | 155/444 (34.9) | 347/444 (78.1) |
Note.—Data are reported as numbers, means ± SDs with ranges in parentheses, or proportions with percentages in parentheses. At Least Moderate Narrowing and Severe Narrowing columns refer to the presence of at least one spinal level of moderate or severe disease per imaging study.
Note.—Data are reported as numbers of patients or cases, means ± SDs with ranges in parentheses, or proportions with percentages in parentheses. At Least Moderate Narrowing and Severe Narrowing columns refer to the presence of at least one spinal level of moderate or severe disease per imaging study. NF = neural foramen, SA = subarticular, SC = spinal canal.
The final dataset is available at https://www.kaggle.com/competitions/rsna-2024-lumbar-spine-degenerative-classification and https://mira.rsna.org/dataset/6 . MRI scans are provided in Digital Imaging and Communications in Medicine format along with comma-separated values files that include the stenosis annotations and series descriptions for each patient (Data Structure section in Appendix S1 ).
Discussion
We curated and created a large, expert-annotated lumbar spine MRI database, which represents the largest publicly available dataset for lumbar spondylosis. This rich dataset has further potential utility for future investigators, including evaluation of intervertebral disk and vertebral endplate degenerative changes, which were beyond the scope of our competition.
We chose to have relatively loose inclusion criteria with respect to MRI protocols, allowing for multiple “T2-like” sagittal sequences including conventional T2-weighted, short tau inversion recovery, and Dixon sequences and variable axial T2-weighted acquisitions. This was done strategically to increase the generalizability of models trained on diverse imaging protocols.
Our dataset is unique not only in size but also in the diversity of data offered by the large number of contributing institutions and number of expert annotators. Also, few datasets include assessment of subarticular stenosis, which has long been shown to be a cause of back pain and often associated with failed lumbar spine surgery 8. Of the publicly available datasets, the Genodisc dataset most closely matches the current dataset in the depth of assessment and number of patients 9. The Genodisc dataset includes only sagittal images but includes 2287 studies across multiple imaging centers across Europe. An important limitation of the Genodisc dataset, as well as many other lumbar spondylosis datasets, is low representation of high-grade disease by spinal level. We found that there was a very low natural incidence of moderate and especially severe stenosis at the L1-L2 and L2-L3 levels, which may limit model performance at these levels if the dataset is not supplemented for these minority classes.
Limitations of this dataset include the inherently subjective nature of grading degenerative disease in the lumbar spine. We attempted to mitigate against subjective variation by incorporating a training manual for annotators and a preannotation test dataset that used specific criteria based on published grading methodologies for spinal canal, neural foraminal, and subarticular stenosis ( Appendix S3 ). The inclusion of multiple annotators for each patient in the test sets was also intended to improve consistency. Furthermore, because the dataset consists exclusively of lumbar spine MRI examinations performed for the evaluation of spondylosis in patients without surgical hardware, it is not suitable for developing or evaluating models aimed at other pathologies, such as spinal tumors or active infection, or in postoperative patients with hardware.
In summary, the RSNA LumbarDISC dataset represents the largest, most geographically diverse, publicly available expert-annotated dataset of its kind. We hope this dataset will facilitate machine learning research development and improve outcomes in patients with lumbar spondylosis. This dataset is made freely available to all researchers for noncommercial use.
Acknowledgments
The authors would like to thank and acknowledge the contributions of Christopher Carr, MA, Sohier Dane, and Michelle Riopel.
Notas
Data sharing: Data generated by the authors or analyzed during the study are available at https://www.kaggle.com/competitions/rsna-2024-lumbar-spine-degenerative-classification and https://mira.rsna.org/dataset/6 . The data will remain in these two locations indefinitely to be used for non-commercial purposes only. Dataset Contributor Group: Samantha Yost, University of Utah School of Medicine; Nedim Kruscica Berg, d.o.o Sarajevo; Damir Hadzalic, MD, Clinical Center University of Sarajevo; Rahin Chowdhury, MS, University Hospitals Cleveland Medical Center; Conor Waters, MB BAO BCh, FFR RCSI, PGDip, Tallaght University Hospital; Johnathon Harris, BM MCh BSc, MRCSI, Tallaght University Hospital; Arsalan P. Rizwan, MD, PhD, Queen’s University Health Sciences, Kingston Health Sciences Centre; Jianwei Yue, MSc, Queen’s University. Dataset Annotator Group: Arsany Hakim, MD, Bern University Hospital, Inselspital; Lai Peng Chan, FRCR, MBBS, Singapore General Hospital; Vinson Louis Uytana, MD, Cedars-Sinai Medical Center; Anthony Kam, MD, PhD, Loyola University Medical Center; Venkata Naga Srinivas Dola, DM, FRCR, Children’s National Hospital, George Washington University; Girish Bathla, MD, FRCR, Associate Professor, Mayo Clinic, Rochester; Yonghan Ting, FRCR, National University Hospital, Singapore; Daniel Murphy, MD, University of Utah; David Vu, MD, Scripps Clinic Medical Group; Gagandeep Choudhary, MD, MBBS, Oregon Health and Science University; Tze Chwan Lim, FRCR, MBBS, Woodlands Health; Luciano Farage, MD, UNIEURO; Christie Lincoln, MD, MD Anderson Cancer Center; Kian Ming Chew, MBChB, Woodlands Health Singapore; Katie Bailey, MD, University of South Florida; Eduardo Portela de Oliveira, MD, The Ottawa Hospital, University of Ottawa; Fanny Moron, MD, Baylor College of Medicine; Achint Kumar Singh, MD, UT Health San Antonio; Nico Sollmann, MD, PhD, University Hospital Ulm; Kim Seifert, MD, MS, Stanford; Eric D. Schwartz, MD, Director of Neuroradiology, St. Elizabeth’s Medical Center; Mariana Sanchez Montaño, MD, Rh Radiologos; Charlotte Yuk-Yan Chung, MD, PhD, NYU Langone Health; Lubdha Shah, MD, University of Utah; Ling Ling Chan, FRCR, MBBS, Singapore General Hospital; Scott R. Andersen, MD, Colorado Kaiser; Troy Hutchins, MD, University of Utah; Rita Nassanga, MMed, Radiology, MBChB, Makerere University, Kampala Uganda; Rukya Ali Masum, Ohio State Wexner Medical Center; Karl Soderlund, MD, Naval Medical Center Portsmouth; Le Roy Chong, MBBS, FRCR, Changi General Hospital; Jonathan D. Clemente, MD, Carolinas Medical Center; Ali Haikal Hussain, FRCR, MBChB, University of Rochester; Keynes Low, Woodlands Health; Mohiuddin Hadi, MD, University of Louisville; Michael Hollander, MD, Danbury Radiology Associates; Nurul Hafidzah Binti Rahim, MD, Hospital Putrajaya, Malaysia; Angela Guarnizo Capera, MD, Fundación Santa Fe de Bogotá; Lex A. Mitchell, MD, Hawaii Permanente Medical Group; Gennaro D’Anna, MD, ASST Ovest Milanese; Ellen Hoeffner, MD, University of Michigan; John L. Go, MD, University of Southern California; Facundo Nahuel Diaz, MD, Atrys Health/Hospital Italiano de Buenos Aires; Jacob Ormsby, MD, MBA, University of New Mexico; Jaya Nath, MD, Northport VA Medical Center; Nathaniel von Fischer, MD, Kaiser Permanente South San Francisco; Vahe M. Zohrabian, MD, Northwell Health, North Shore University Hospital; Mary Niroshinee Muthukumarasamy, MBBS, MD, Ministry of Health, Sri Lanka; Sucari Vlok, MBChB, MMed, Tygerberg Hospital, University of Stellenbosch; Nafisa Paruk, FCRad Diagnostics, 2SA, MBChB, Dr. Oosthuizen and Partners; Shayan Sirat Maheen Anwar, MBBS, FCPS, Aga Khan University Hospital; Giuseppe Cruciata, MD, Stony Brook University Hospital; Omar Islam, MD, FRCPC, Queen’s University; Loizos Siakallis, MD, University College London; Ichiro Ikuta, MD, MMSc, Mayo Clinic Arizona. Competition Data Notebook and Curation Group: Abhinav Suri, MPH, University of California Los Angeles; Andrew Wentland, MD, PhD, University of Wisconsin; Hari Trivedi, MD, Emory University; Jason Sho, Radiological Society of North America.