
Whitepapers
The latest capabilities of the Diagnostic OS
Oblique MPR in the main viewer (not only on the MPR viewer)

.png)
Browse all
.png)
Highlight Critical Findings with the New Frontier in Mammography
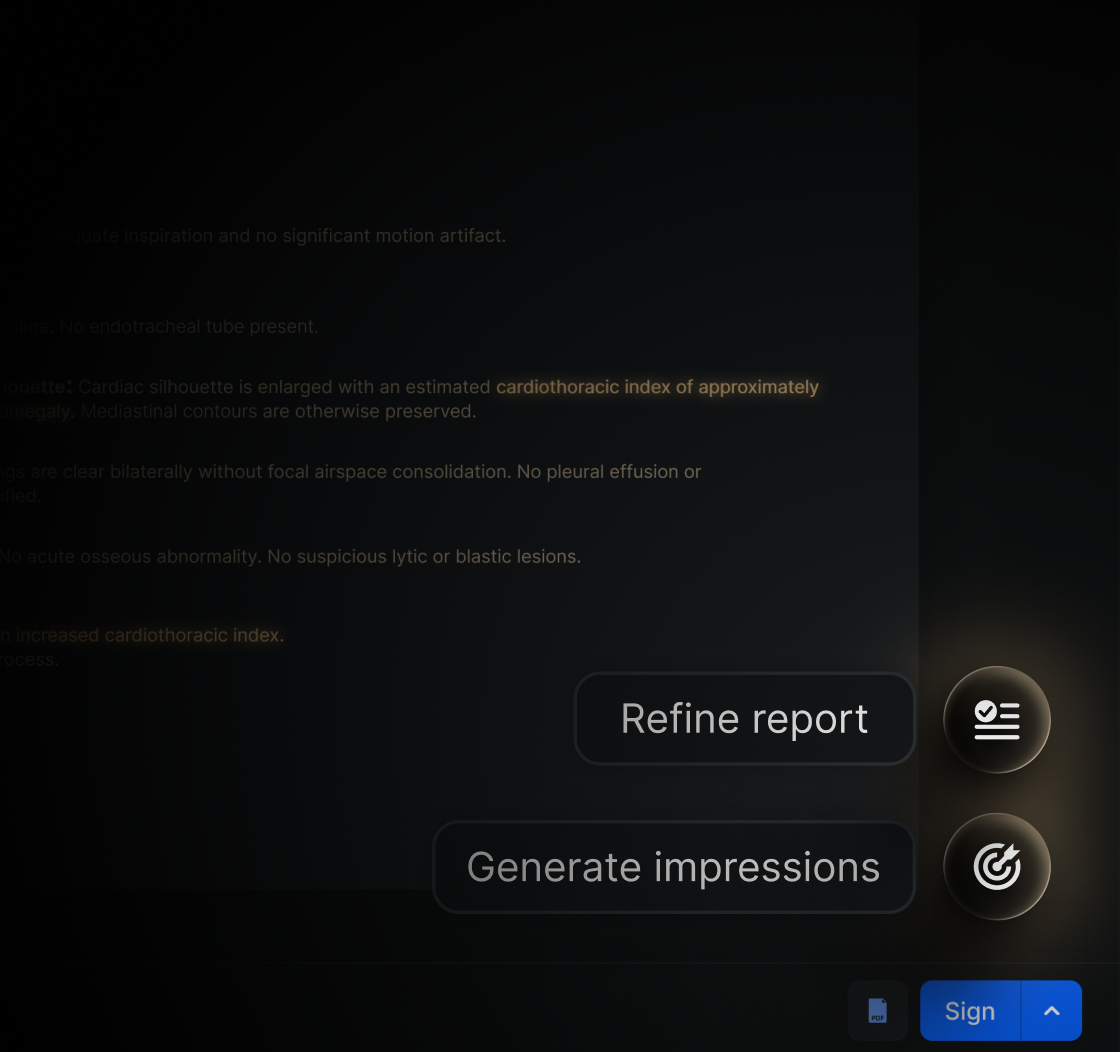
As part of the improvements aimed at strengthening diagnostic capability in mammography studies, the viewer incorporates three new post-processing filters: Density, Edges, and Micro-detail, available for the targeted re-evaluation of FFDM and DBT studies.
These tools expand the radiologist's ability to interrogate borderline or equivocal findings without leaving the workstation's standard view.
What it is
These are three non-destructive post-processing filters that apply a reversible enhancement solely to the displayed pixel data, without replacing the original DICOM. Each filter is designed for a specific purpose: Density restores the visibility of asymmetries and focal densities by increasing local contrast; Edges sharpens the perceptible margin of masses, spiculations, and subtle architectural distortions; and Micro-detail increases the visibility of fine and pleomorphic microcalcifications, preserving their morphology for BI-RADS classification.
What it is for
The post-processing filters allow you to:
- Improve the assessment of findings in dense and heterogeneously dense breasts (ACR categories C and D).
- Support the diagnostic workup during screening callbacks.
- Facilitate the assignment of BI-RADS descriptors when characterizing localized findings.
- Reconcile findings across DBT source slices, the synthesized 2D image, and prior comparison studies.
- Complement the reference diagnostic image without replacing it, by preserving the original presentation.
How it affects the workflow
Previously, the radiologist had to manually adjust window/level parameters or other settings to try to improve the visualization of specific findings, which could interrupt the reading sequence. With these filters, each enhancement is applied with a single click from the Post-processing panel and can be combined with other functions such as window/level and pan/zoom, enabling a faster, more targeted review without modifying the original diagnostic image.
Have you tried it yet? If you have any questions, our team of experts is ready to help you via the Eden PACS support chat, or at soporte@edenmed.com
.png)
Superior Control, Agile Reading: New Features in the PET-CT Fusion Viewer
In PET-CT, image interpretation depends not only on the quality of the study but also on how efficiently the specialist interacts with the fused anatomical and metabolic information. The new features in our viewer have been designed to give nuclear medicine physicians more direct, precise, and flexible control over how PET findings are displayed on CT images.
Definition
This update integrates advanced display controls into the fusion viewer, specifically for lookup table (LUT) selection, SUV threshold adjustment, and PET overlay transparency. These tools are designed to tailor the display to the specific clinical question, while maintaining fast, intuitive interaction.
Functionality
The specialist can select the LUT from a drop-down menu, allowing them to quickly choose the optimal visual style for interpreting metabolic activity. SUV threshold adjustment is now multidimensional: via a slider, numeric entry, or direct mouse controls, following a logic similar to adjusting window width and level (window width/level) in CT. Likewise, the alpha transparency of the PET layer can be modified to achieve the exact balance between metabolic and structural detail.
In addition, when automatic synchronization is enabled (on by default), any change to the SUV threshold is instantly propagated to all display planes. This ensures absolute visual consistency throughout the entire interpretation process.
Value and Clinical Application
The fundamental value of these features lies in speed, control, and consistency. The nuclear medicine physician needs to adjust the display quickly to identify lesions, assess disease burden, and correlate FDG uptake with structural findings. By offering multiple intuitive adjustment methods, operational friction is eliminated, allowing attention to focus on interpretation rather than on manipulating the software.
A critical clinical scenario is the evaluation of patients with metastatic disease. In these cases, it is vital to review multiple lesions throughout the body, distinguish pathological uptake from background activity, and correlate findings with CT anatomy. The ability to instantly modify the SUV threshold and the appearance of the fusion facilitates detection and characterization, while synchronization between views ensures a more efficient, comprehensive review.
Impact on Workflow
These features optimize the clinical workflow by making display adjustments feel more natural. The specialist interacts with the fusion using whichever method is most convenient at any given moment: mouse, keyboard, or sliders.
This translates into tangible benefits: reduced post-processing time, minimized repetitive manual tasks, and a smooth reading experience. For the nuclear medicine physician, this means faster review of complex cases, fewer interruptions to the cognitive process of interpretation, and a tool that responds precisely to the demands of daily clinical practice.
Ultimately, these improvements are not just interface tweaks; they are workflow evolutions that enable more efficient interpretation in real-world clinical settings.
.png)
Automatically Send PET-CT Segmentations to Your Report
As part of improvements aimed at strengthening quantitative analysis in nuclear medicine studies, the viewer now has the capability to automatically export segmentation measurements and tables directly to the PET-CT report. This functionality facilitates the integration between the analysis performed in the viewer and the final clinical documentation.
What It Is
This is a functionality that allows the values obtained during the analysis of the PET-CT study, including measurements derived from segmentations or volumes of interest, to be transferred to the structured report. The exported information can include relevant quantitative metrics and tables generated during the segmentation process, eliminating the need to manually transcribe this data into the report.
What It's For
The export of segmentation measurements and tables enables:
• Incorporating quantitative results directly into the PET-CT report.
• Reducing errors resulting from manual data transcription.
• Maintaining consistency between the analysis performed in the viewer and the content of the report.
• Facilitating structured documentation of quantitative findings.
• Improving efficiency in the report preparation process.
How It Affects the Workflow
Previously, the values obtained during analysis had to be manually copied from the viewer to the report. With this functionality, the results generated during segmentation or measurement can be automatically integrated into the report, allowing the radiologist or nuclear medicine physician to complete the report more quickly and accurately.
.png)
Visualize CT Scans Clearly with Table Removal
As part of improvements aimed at optimizing the visual quality of reconstructions and reducing manual post-processing time, automatic table removal has been added for CT studies. This enhancement produces cleaner MPR and 3D reconstructions, focusing solely on the anatomy of interest and facilitating diagnostic visualization.
What It Is
This is a digital processing tool that automatically identifies and removes the pixels corresponding to the examination table in multiplanar reconstructions (MPR) and 3D volumes. It uses advanced segmentation algorithms to differentiate the patient’s anatomy from external table elements, removing them without affecting anatomical structures.
What It’s For
Table removal in 3D and MPR reconstructions makes it possible to:
- Generate 3D images with a clean background, free of table artifacts that obstruct the view.
- Obtain sharper MPR slices by eliminating dense table structures that could interfere with density measurement or visualization.
- Improve the quality of clinical presentations and meetings by showing only the patient’s anatomy.
- Facilitate automatic organ segmentation by removing unnecessary background noise.
- Speed up the workflow by avoiding manual slice-by-slice editing.
How It Affects the Workflow
Previously, to obtain a clean 3D reconstruction or an MPR without the table, users had to manually crop, edit slices, or apply complex masks, a tedious process that consumed valuable time. With this feature, the system processes the volume automatically, delivering reconstructions ready for immediate viewing and allowing clinicians to focus on diagnosis.
What Changes Compared to Previous Versions
In previous versions, the table remained visible in all reconstructions, forcing users to either tolerate the visual obstruction or invest time in manual post-processing. With this update:
- Table removal is applied automatically in the background.
- 3D and MPR reconstructions are aesthetically superior and functionally clearer.
- Time spent on manual image editing is reduced.
- Accuracy improves in visualizations that require isolating soft tissue without interference.
Implications for the User
The feature operates transparently within the reconstruction process. The radiologist or technologist simply selects the desired reconstruction type (MPR or 3D), and the system delivers the final result with the table automatically removed. No additional interaction is required, ensuring a continuous, friction-free workflow.
Final Considerations
Automatic table removal in volumetric reconstructions represents a significant advance in image quality and post-processing efficiency. This enhancement not only optimizes visual resources, but also elevates the presentation of studies, facilitating more effective communication of findings and enriching the diagnostic experience within the RIS-PACS platform.
Have you tried it yet? If you have any questions, our team of experts is ready to help you in the Eden PACS support chat, or by email at soporte@edenmed.com.
.png)
Filter Out Ambient Chaos with Your New Voice Dictation
As part of ongoing improvements to the reporting experience, the system incorporates optimizations to the voice dictation module aimed at reducing the impact of ambient noise. These improvements enable more accurate transcription in real clinical environments, where absolute silence is not always possible.
What It Is
This is an enhancement to the voice dictation engine that incorporates background noise filtering algorithms and improved recognition of medical speech. The system distinguishes the user's voice from ambient sounds such as nearby conversations, medical equipment, or office noise, prioritizing capture of the primary voice during dictation.
What It's For
The voice dictation improvements enable:
• Increased transcription accuracy in noisy environments.
• Reduced manual corrections after dictation.
• Improved continuity of the reporting workflow.
• Effective use of dictation outside quiet rooms.
• Reduced user fatigue during extended sessions.
How It Affects the Workflow
Previously, voice dictation could be affected by external noise, causing transcription errors and frequent pauses for corrections. With noise filtering, users can dictate more fluidly and continuously, reducing interruptions and speeding up the reporting process without changing their work habits.
What Changes from Previous Versions
In previous versions, dictation depended heavily on ideal ambient conditions. With this update:
• Active background noise filtering is introduced.
• Detection of the primary voice is improved.
• Capture of irrelevant sounds is reduced.
• Overall dictation accuracy is increased.
Implications for the User
The improvement is transparent to the user and requires no additional configuration. Final quality also depends on the microphone used and the dictation style. In some cases, the system may require a brief adaptation period to the user's voice pattern to maximize accuracy.
Final Considerations
The voice dictation improvements with noise filtering reinforce the use of dictation as the primary reporting tool, even in dynamic clinical environments. This optimization reduces friction, improves efficiency, and contributes to a more natural and reliable reporting experience within the RIS-PACS.
Have you tried it yet? If you have any questions, our team of experts is ready to help you in the Eden PACS support chat, or by email at soporte@edenmed.com
.png)
Clean Up Your Workspace with Study Closure
As part of improvements aimed at optimizing use of the viewer and reducing unnecessary load on the system, the study window closing feature has been incorporated. This improvement enables intelligent management of active sessions, keeping the work environment organized and efficient.
What it is
This is a feature that automatically closes study windows that are no longer in use, according to configurable system rules. Closing can be triggered upon completing the interpretation, signing the report, switching studies, or after a period of inactivity.
What it is for
Automatic window closing enables:
• Avoiding the accumulation of open studies in the viewer.
• Reducing unnecessary consumption of browser and system resources.
• Keeping the work environment clean and focused.
• Decreasing errors caused by confusion between open studies.
• Improving performance during prolonged reading sessions.
How it affects the workflow
Previously, the user had to manually close each study window, which could lead to oversights and visual overload. With this feature, the system manages closing automatically, allowing the user to move on to the next study without interruptions or additional tasks.
What changes compared to previous versions
In previous versions, closing studies depended entirely on manual action by the user. With this update:
• Window closing is automated according to defined events.
• The number of simultaneously open windows is reduced.
• Use of the viewer's memory and resources is optimized.
• Stability during long sessions is improved.
Implications for the user
The feature operates automatically and requires no configuration or intervention from the user. Its behavior is consistent and predictable, allowing the radiologist to focus exclusively on interpretation without worrying about manually managing windows.
Final considerations
Automatic closing of study windows contributes to a more orderly, secure and efficient workflow. This feature reduces operational friction, improves viewer performance and supports a smoother reading experience within the RIS-PACS system.
Have you tried it yet? If you have any questions, our team of experts is ready to help you in the Eden PACS support chat, or by email at soporte@edenmed.com
.png)
Measure Anatomy As It Truly Is with Curved Measurement
As part of the advanced analysis tools available in the viewer, curved measurement functionality has been incorporated, designed to evaluate intensity variations or quantitative values along a path defined by the user on the image. This tool enables more precise analysis of linear structures or extended regions of interest.
What it is
It is a measurement tool that allows a free line or curve to be drawn on the image to obtain a profile of values along that path. Depending on the modality, the curve can represent signal intensity, Hounsfield units, activity, density or other parameters derived from the image data. The result is displayed as a graph associated with the trace.
What it is for
Curved measurement is useful for:
• Analyzing density or signal variations along anatomical structures.
• Evaluating gradients, transitions or progressive changes in tissues.
• Comparing behaviors between different segments of the same structure.
• Supporting the characterization of linear lesions or vascular pathways.
• Complementing traditional point measurements or ROIs.
How it affects the workflow
Previously, this type of analysis required external tools or approximations using multiple point measurements. With curved measurement, the analysis is performed directly in the viewer, in a single step. The user can draw the curve, define its path and immediately view the resulting graph, without interrupting their reading or switching modules.
What changes compared to previous versions
Prior to this update, the viewer offered basic linear measurements and ROIs, without the ability to perform continuous analysis along a path. With this update:
• Continuous curve-based analysis is incorporated.
• Graphical visualization associated with the trace is enabled.
• Precision is improved in studies that require longitudinal evaluation.
• The viewer's analytical capabilities are expanded without increasing complexity.
Implications for the user
Use of curved measurement is subject to the permissions configured according to each client's policies. Interpretation of the graph depends on the modality and the parameter measured. The tool is designed to be consistent with the viewer's other measurement instruments, maintaining a coherent experience.
Curved measurement expands the scope of quantitative analysis within the RIS-PACS viewer, making it possible to evaluate continuous behaviors that cannot be captured with discrete measurements. This feature strengthens diagnostic decision-making and reduces reliance on external software in advanced clinical workflows.
Have you tried it yet? If you have any questions, our team of experts is ready to help you in the Eden PACS support chat, or by email at soporte@edenmed.com
.png)
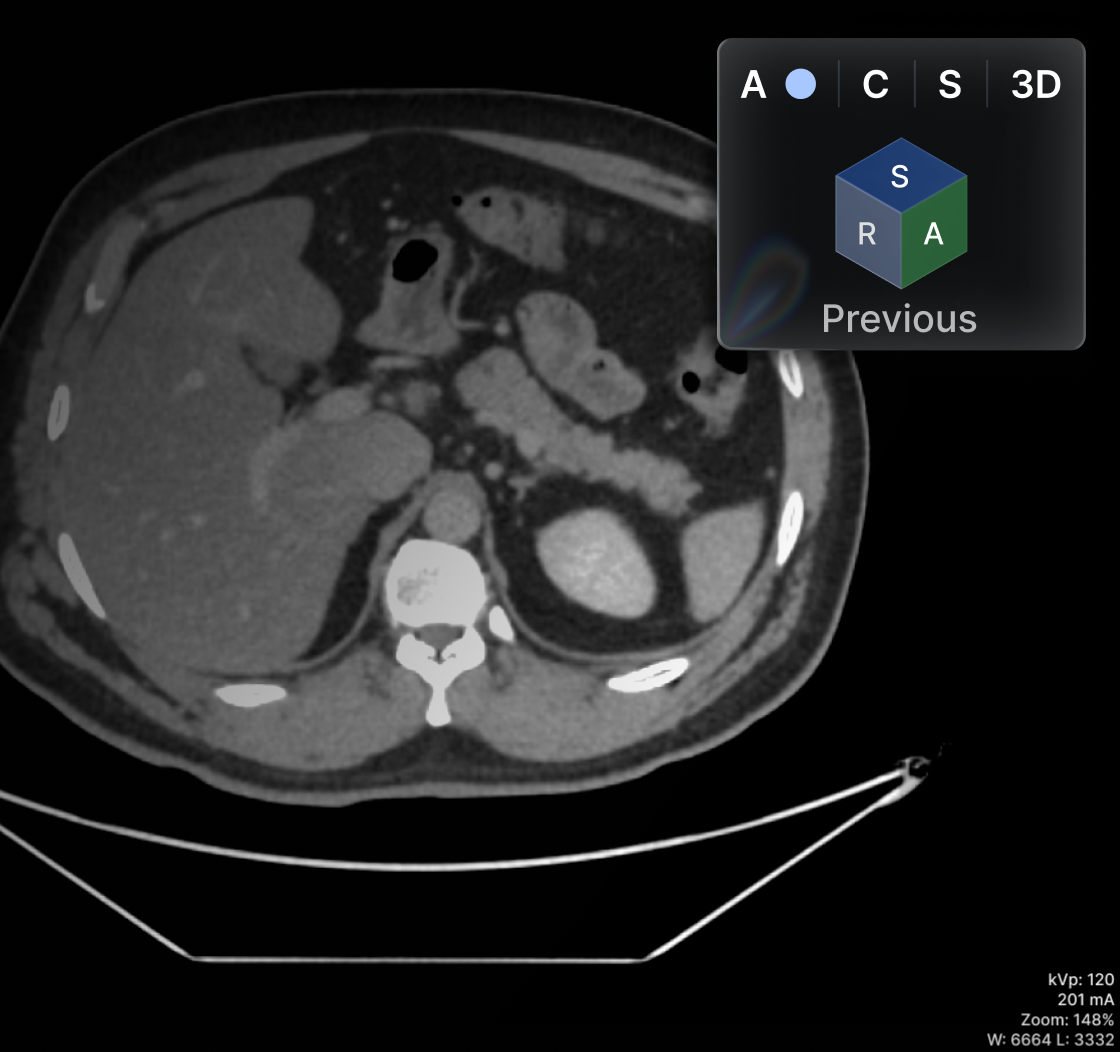
Boost Precision with MPR and 3D Directly in Your Standard Viewer
As part of the evolution of the advanced viewer, the MPR (Multiplanar Reconstruction) module and the 3D module are now unified within the conventional 2D viewer. This enhancement allows all 2D, MPR, and 3D views to be operated within a single continuous environment, eliminating the need to open separate modules and improving the consistency of anatomical and volumetric analysis.
What It Is
This is a feature that integrates classic 2D visualization, MPR reconstructions (axial, coronal, sagittal, and oblique), and the 3D volumetric model into a single interface. Users can activate MPR or 3D directly from the 2D viewer without switching tools or loading a separate module.
Any adjustment made in MPR, whether cursor position, thickness, orientation, or display window, is automatically reflected in the corresponding 2D view. In turn, manipulations in the 3D volume (rotation, focus, selection) update the reference point in the 2D and MPR views. This integration creates a single interpretation workflow for CT and MRI studies with volumetric support.
What It’s For
Unifying the 2D viewer with MPR + 3D is useful for:
- Reviewing 2D slices, MPR reconstructions, and 3D volume within a single workspace.
- Quickly correlating a lesion between 2D and MPR/3D without opening additional tools.
- Improving the radiologist’s spatial orientation in complex studies.
- Facilitating anatomical planning and pre-interventional analysis from the primary viewer.
- Reducing operational time by centralizing all views within the same module.
How It Affects the Workflow
Previously, users had to:
- Review 2D images in the conventional viewer.
- Open a separate module for MPR.
- Open another module for 3D if volume was needed.
This created interruptions, duplicated interactions, and constant context switching.
With the unification:
- Users always remain within the 2D viewer.
- MPR and 3D are activated as modes within the same space.
- The cursor and reference points are shared across 2D, MPR, and 3D.
- Volumetric navigation becomes part of the study’s primary reading workflow.
What Changes Compared to Previous Versions
Prior to this enhancement, 2D, MPR, and 3D operated as independent modules that shared neither interface nor navigation state.
With this update:
- All visualization modalities are integrated into a single viewer.
- User actions are synchronized in real time across views.
- The need to load external modules is eliminated.
- Diagnostic continuity improves and operational time is reduced.
- The viewer engine is updated to support combined operations without impacting performance.
Implications for the User
- The volumetric interpretation experience becomes more seamless, but may require adjustment if users were accustomed to separate modules.
- Performance depends on local hardware capacity, volume size, and GPU availability.
- Some advanced features may be enabled or restricted depending on role and the policies configured by the client.
Final Considerations
The unification of MPR + 3D into the 2D viewer represents a significant step toward a comprehensive viewer. It enables immediate correlation between planes, integrated volumetric navigation, and a continuous analysis workflow without switching tools. With this enhancement, the RIS-PACS adopts capabilities typical of advanced reconstruction workstations, while maintaining the simplicity and fluidity of the centralized web viewer.
Have you tried it yet? If you have any questions, our team of experts is ready to help you in the Eden PACS support chat, or by email at soporte@edenmed.com
Never Deliver a Late Result Again: SLAs in Eden PACS
SLAs for the Radiologist Worklist
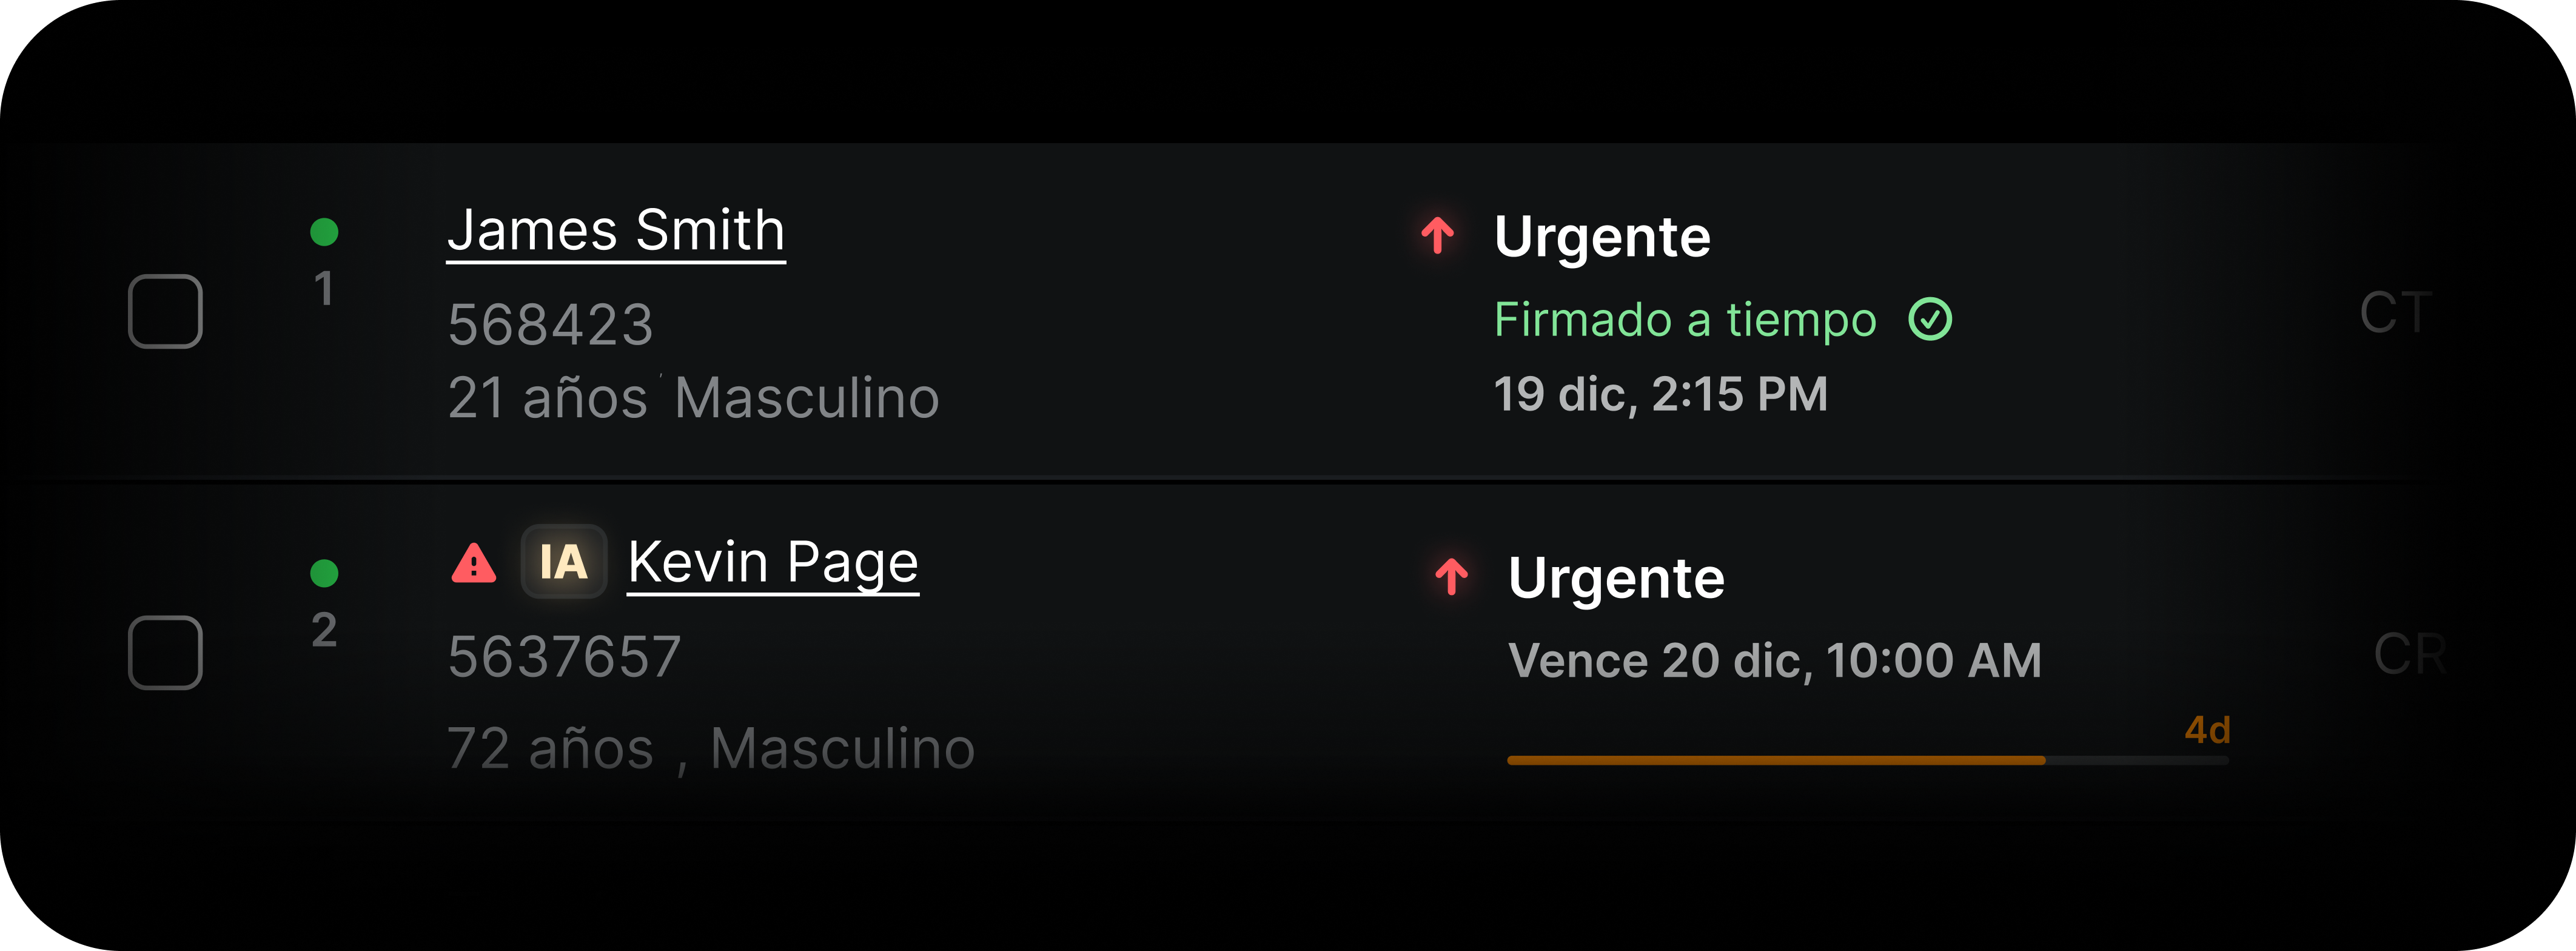
As part of the clinical management mechanisms within the Eden PACS platform, a control layer has been added that allows service level agreements (SLAs) to be established for study reading times by radiologists. This functionality ensures clear traceability of response times, especially in contexts with high demand, multiple priority levels, or contractual requirements.
What it is
This is a tool that allows the maximum acceptable interpretation time for a study to be defined and monitored, from its entry into the worklist to the signing of the report. Each study receives a timestamp based on its clinical priority, modality, patient type, or location, and the system triggers alerts if the established deadlines are exceeded.
SLAs can be applied generally or customized by study type, institution, shift, or radiologist group. The system automatically records actual reading times and enables compliance auditing.
What it is for
The SLA tool in the worklist makes it possible to:
- Standardize reading times by priority level (urgent, preferential, routine).
- Improve operational traceability in contexts with multiple readers or institutions.
- Generate compliance metrics to assess clinical or contractual performance.
- Trigger visual alerts when the defined maximum time is approaching or exceeded.
- Facilitate decision-making on the redistribution of pending studies.
How it affects the workflow
Previously, reading times depended solely on the judgment of the radiologist or the operations coordinator, with no clear reference for expected turnaround windows. Now, with integrated SLAs, the system can organize the worklist based on real clinical priorities, reduce delays, and provide transparency into interpretation times.
The alerts do not interfere with the reading workflow, but they allow the user to prioritize critical or urgent cases. Compliance or non-compliance is automatically logged and can be viewed in operational reports or quality dashboards.
Implications for the user
With established reading times, radiologists can organize their workload more efficiently. The system does not block the reading of studies outside the SLA, but it does visually indicate when a study requires priority attention.
Institutions can use these metrics to validate delivery times, improve shift assignment, or adjust their subspecialty offering.
Final considerations
The SLA module for the worklist is a key tool for improving the quality of radiology service, especially in contexts with multiple radiologists, differentiated contracts, or institutions with demanding delivery times.
Its implementation requires no changes to the viewer or the reading console. It can be configured from the RIS-PACS administration panel and adjusted by modality, institution, or shift.
Have you tried it yet? If you have any questions, our team of experts is ready to help you in the Eden PACS support chat, or by email at soporte@edenmed.com
Get Complete Traceability with the New Change History
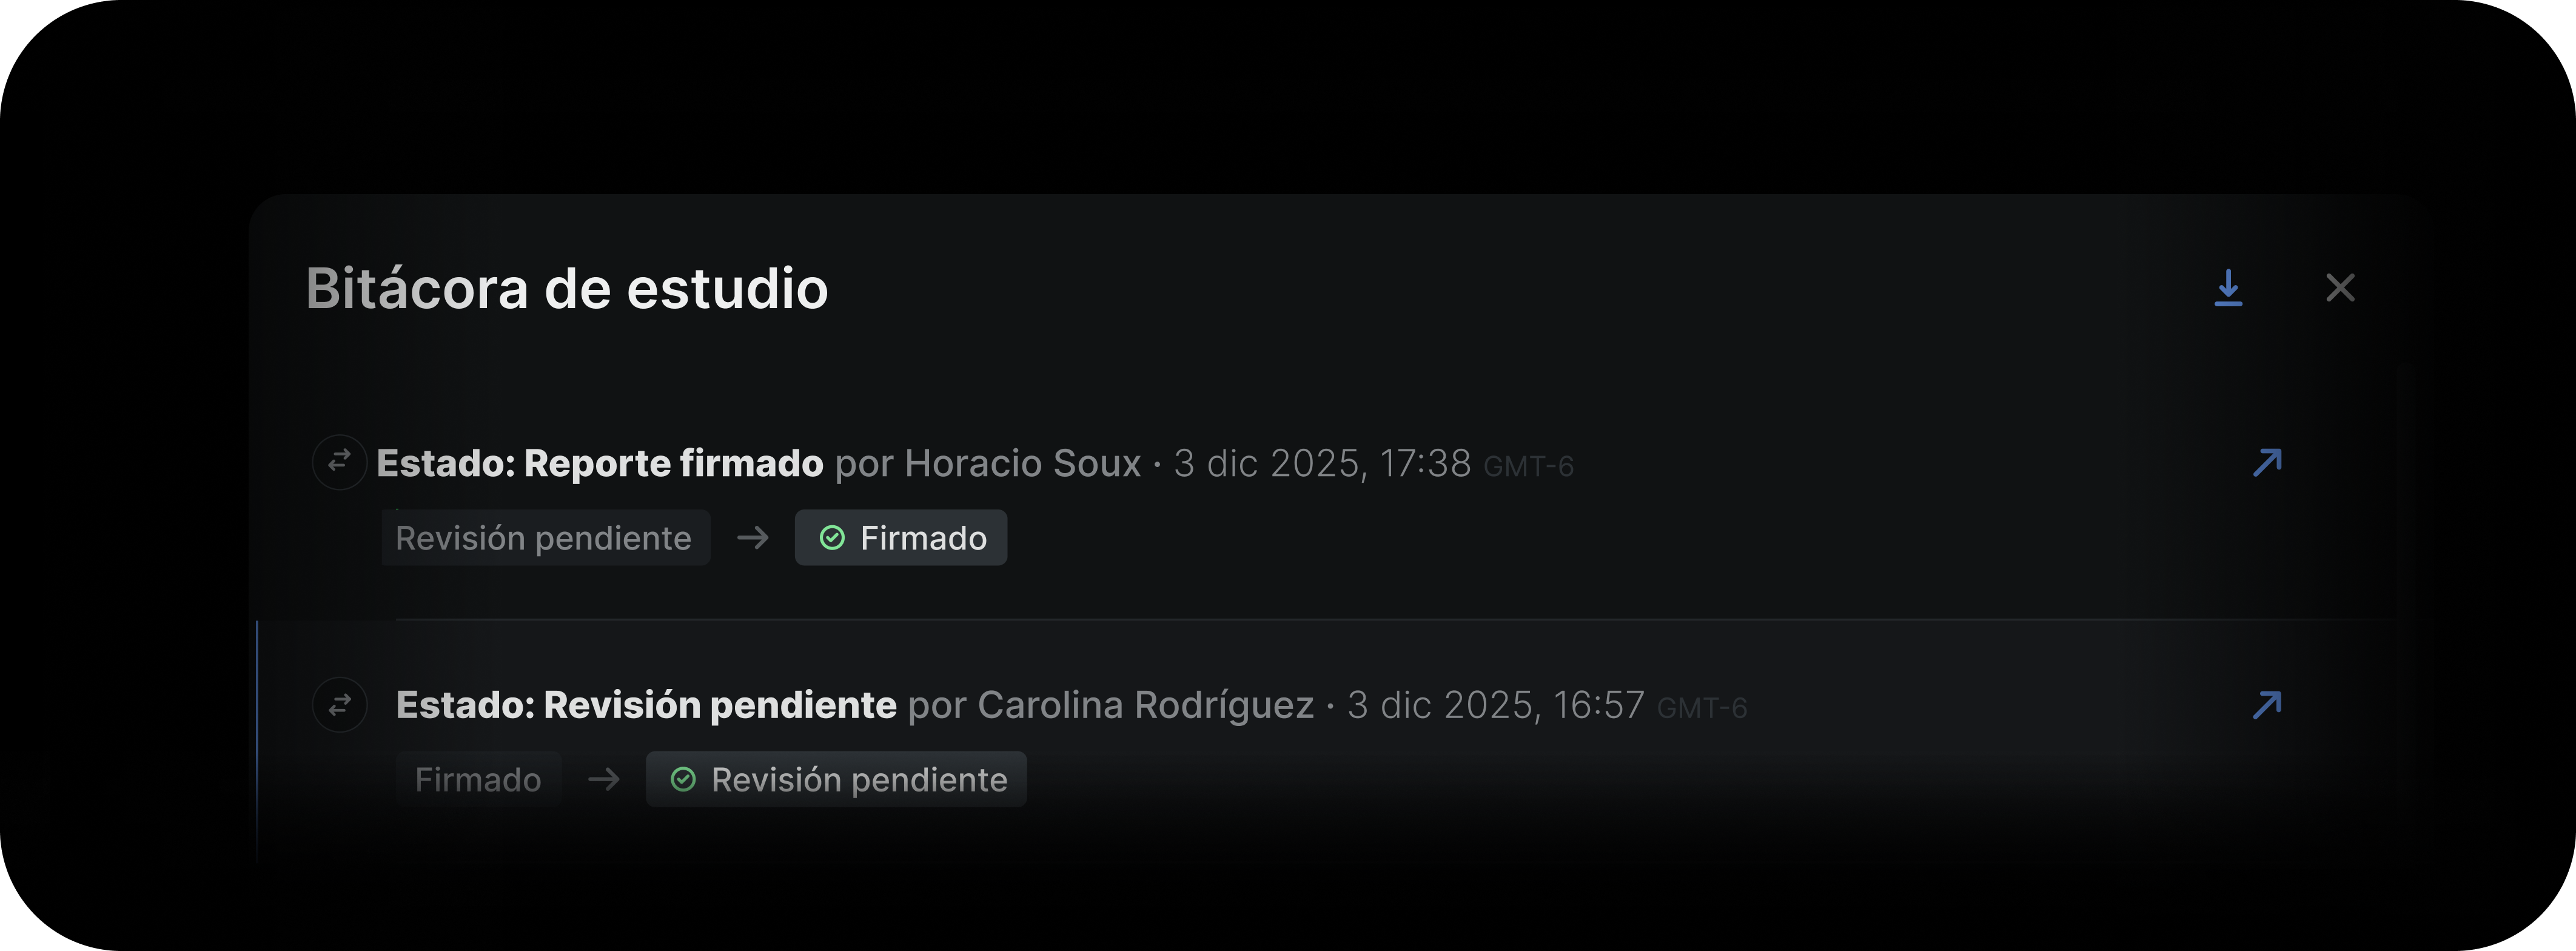
As part of the improvements aimed at providing greater traceability and clinical control, the Change History feature has been added to the viewer and the study panel, allowing users to view, in an organized manner, all the changes, actions, and relevant events that have occurred on a study since it entered the system.
What it is
This is a tool that shows, in a single panel, the chronological record of activities associated with a study, including movements, modifications, statuses, users involved, and reporting workflow events. The history allows users to know what happened, when it happened, and who performed each action.
The information is presented in a structured manner according to the metadata captured by the system, and may include automatic (system) events and manual (user) events, depending on the client's configuration.
What it is for
The history is useful for:
- Auditing the complete process of a study from receipt to delivery.
- Identifying who opened, modified, or signed a report.
- Reviewing status changes, interpretation attempts, reassignments, or returns.
- Resolving operational questions between areas (technology, support, radiology, referring clinicians).
- Improving traceability in institutions with multiple radiologists, shifts, or modalities.
How it affects the workflow
Previously, traceability depended on isolated queries in the RIS or on non-integrated records. With this tool, action information is directly accessible within the study, without requiring additional searches.
The user can immediately check whether the study was moved, reassigned, corrected, or reopened, allowing clearer management of the report's lifecycle. This reduces support times, avoids operational confusion, and promotes transparency in the clinical process.
What changes compared to previous versions
Prior to this addition, the system did not offer a unified panel showing the detail of events and modifications for a study. The information was scattered across modules or not available to the end user.
With this update:
- Events are centralized in a single panel.
- Chronological visualization with user and action detail is enabled.
- Clinical and administrative auditing of each study is improved.
Implications for the user
The information visible in the history depends on the configured permissions and the client's policies.
- Some events may be visible only to administrators or coordinators.
- The level of detail may vary depending on how the RIS-PACS logs events.
Users can rely on this tool to resolve discrepancies in statuses, validate workflows, and coordinate with support without requiring complex technical inquiries.
Final considerations
Change History improves operational transparency and strengthens control over the study lifecycle in institutions with high volume or multiple actors involved in the reporting process. Its direct integration in the viewer facilitates review without switching modules and adds an extra layer of security, auditing, and order to the management of clinical studies.
Have you already tried it? If you have any questions, our team of experts is ready to help you in the Eden PACS support chat, or via email at soporte@edenmed.com
Calculate Volumes with VOI in the PET/CT Fusion Viewer
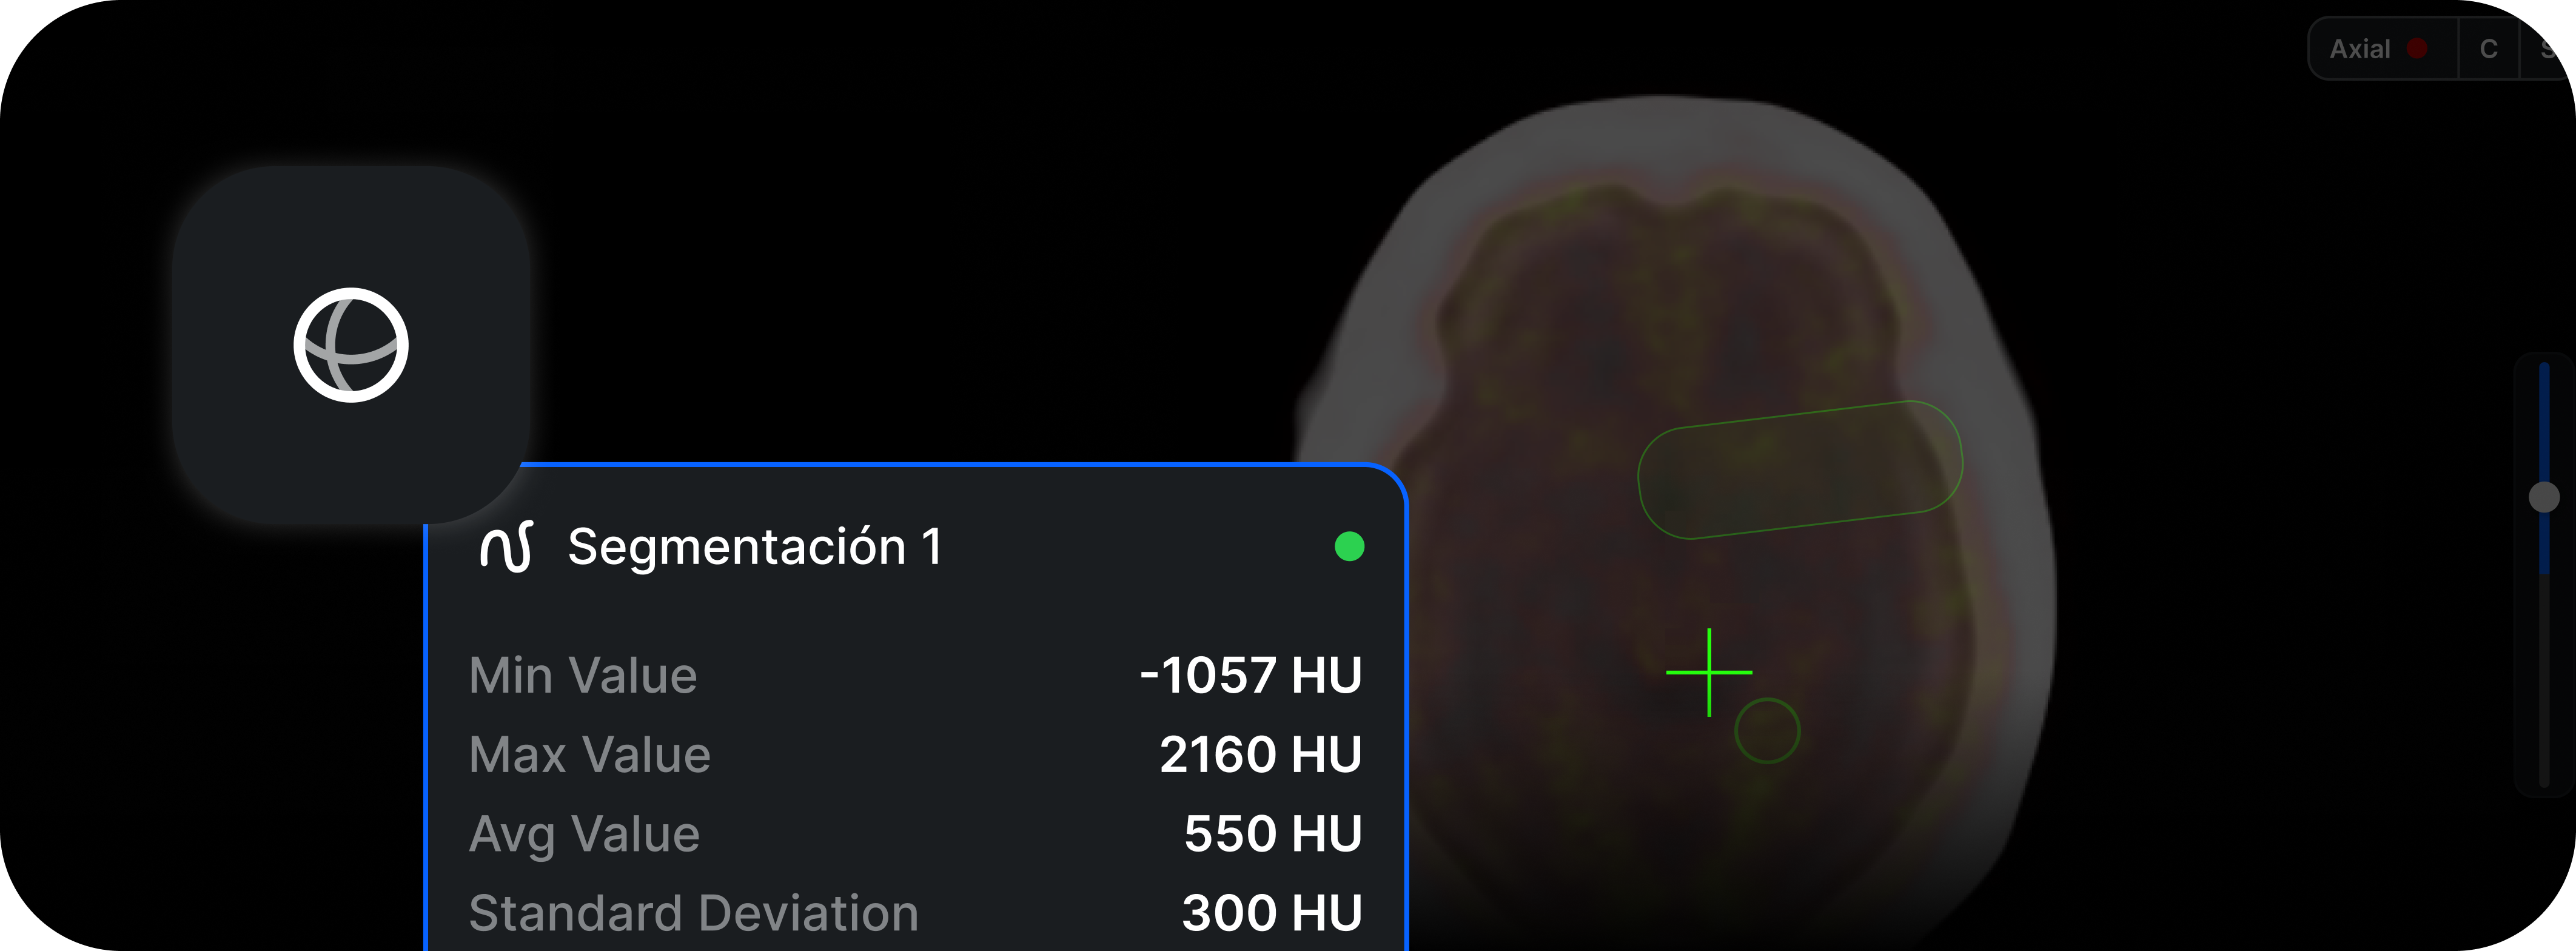
As part of strengthening the viewer's advanced capabilities for Nuclear Medicine, the ability to create, edit, and analyze VOIs (Volumes of Interest) directly on hybrid SPECT-CT and PET-CT studies has been added. This tool enables more precise quantitative measurements and integrated functional-anatomical characterization.
What it is
The VOI tool allows the user to delimit three-dimensional volumes on the functional images (SPECT or PET) and simultaneously view their anatomical correlation on CT. The generated VOIs can calculate basic statistics such as maximum, minimum, average, and approximate volume, depending on the data available in the study. The tool supports spherical, rectangular, and free-form (3D) VOIs, with visualization in multiple planes.
What it is for
The tool is useful for:
- Quantitative characterization of uptake foci.
- Lesion tracking in comparative studies.
- Consistent measurements in PET and SPECT-CT on equipment that exports quantitative data.
- Support for radiologists and nuclear medicine physicians in assessing therapeutic response.
- Improving the accuracy of integrated functional-anatomical readings.
How it affects the workflow
Previously, the user had to take 2D measurements or resort to external post-processing software. With this improvement, volumetric analysis is performed directly in the PACS viewer, aligned with the CT and without additional steps. VOIs can be moved, adjusted, or deleted, and remain visible while the user works within the same study. They are also integrated into the existing measurement workflow without modifying previous tools.
What changes compared to previous versions
Prior to this update, the viewer only allowed point or linear measurements on Nuclear Medicine studies. There was no native VOI capability for SPECT-CT, and the tool was limited to PET-CT in basic modes.
Now:
- VOI is enabled for both PET-CT and SPECT-CT.
- Integration with CT for anatomical reference is improved.
- Basic volumetric statistics are added where the equipment data allow it.
- Performance when manipulating 3D volumes is optimized.
Implications for the user
VOI availability depends on the quality of the study and the metadata sent by the Nuclear Medicine equipment.
- Some SPECT-CT studies only allow VOI on the "attenuation corrected / registered" series.
- Quantitative measurements may vary if the manufacturer does not include the necessary calibration factors or metadata.
Final considerations
The VOI tool significantly enhances the viewer's capabilities for Nuclear Medicine, enabling more comprehensive analysis within the usual PACS workflow. It facilitates clinical interpretation, reduces dependence on external software, and improves the quality of longitudinal follow-up. Its use is especially recommended in comparative studies, therapeutic follow-up, and lesion characterization in PET-CT and SPECT-CT, in accordance with the institution's protocols.
Have you already tried it? If you have any questions, our team of experts is ready to help you in the Eden PACS support chat, or via email at soporte@edenmed.com
Achieve Specialized Precision with the New SPECT/CT Viewer
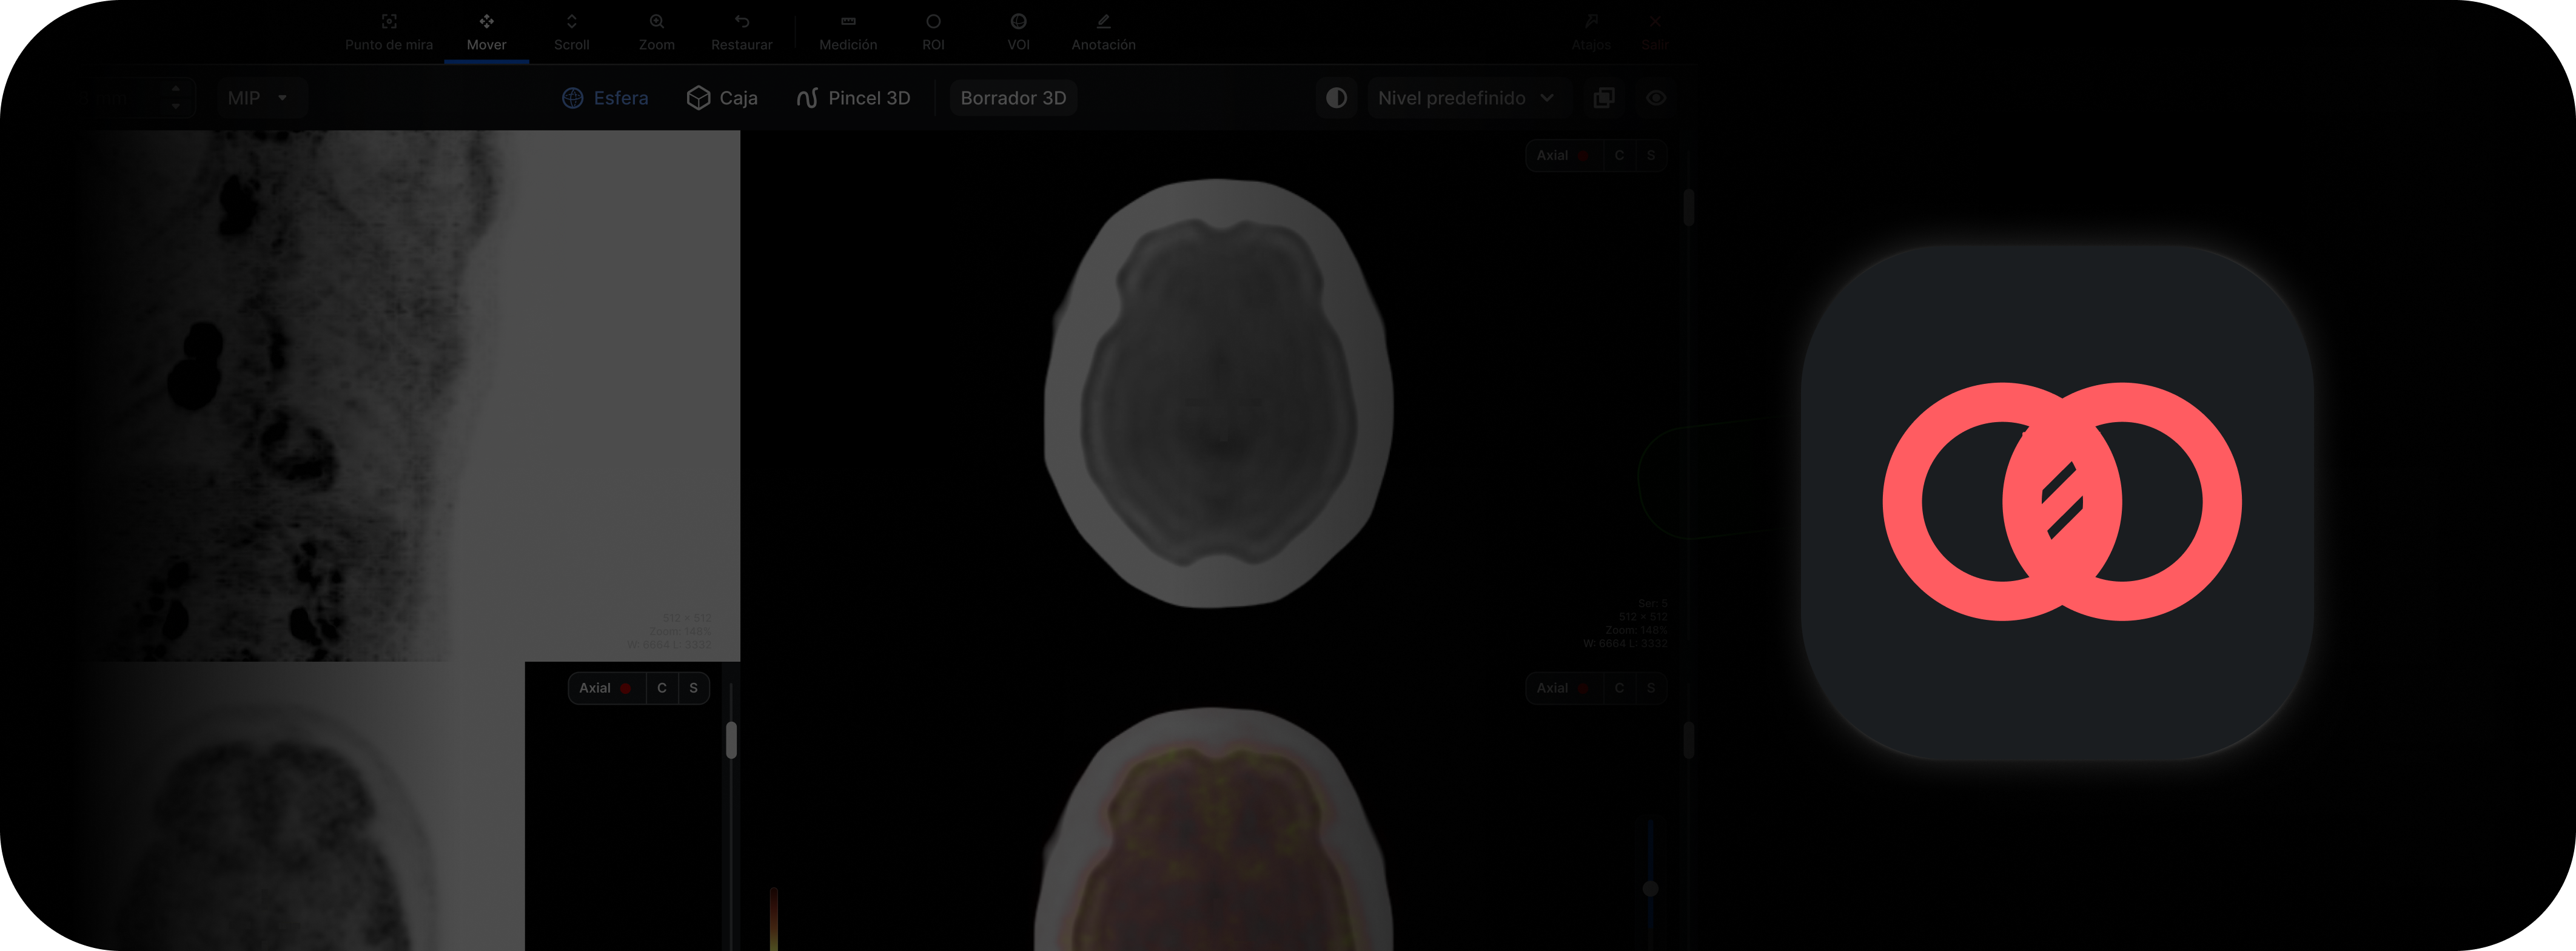
As part of the enhancement of the viewer's advanced capabilities, it is now possible to perform SPECT/CT image fusion directly within the RIS-PACS system. This feature extends previous capabilities, which were limited exclusively to PET/CT fusion, and broadens the viewer's clinical utility in nuclear medicine and oncology.
What it is
This is a tool that allows the radiologist to overlay functional images obtained by SPECT with the anatomical images from a CT, achieving an integrated visualization. The system leverages the spatial registration information included in the DICOM series to automatically align both modalities and display the study jointly in the viewer.
What it is for
SPECT/CT fusion allows:
- Correlating functional findings with their precise anatomical location.
- Improving interpretation in oncology, cardiology, and neurology.
- Performing faster, more reliable evaluations without the need for external software.
- Ensuring that the radiology report includes both metabolic and structural information.
How it affects the workflow
Previously, users had to use specialized workstations or additional software to fuse SPECT with CT. Now, the integration can be performed directly from the RIS-PACS viewer, within the same reading workflow, without switching environments or losing continuity. This reduces interpretation times and avoids dependence on external workstations.
What changes compared to previous versions
Until now, fusion was only available for PET/CT. With this update, it is also enabled for SPECT/CT, provided that the series sent from the equipment include the necessary spatial information. In studies where this is not met, the viewer will display a warning or will not allow the overlay.
Implications for the user
In SPECT/CT studies, it is important to keep in mind that nuclear medicine equipment generates different reconstruction series: an "uncorrected" one (without attenuation map) and a "corrected" one (Corrected/AC), which is the one aligned with the CT. Depending on the manufacturer, not all series include the spatial data required for automatic fusion. For this reason, it is always recommended to review and load the attenuation corrected or SPECT/CT Registered series when available, since it is the only one that can be displayed correctly fused with the CT.
Final considerations
The fusion of SPECT/CT studies expands the clinical capabilities of the RIS-PACS viewer and improves the integration of functional and anatomical information in nuclear medicine settings. Its correct use depends on properly selecting the series sent and on the configuration of the acquisition equipment.
For optimal performance, it is recommended to coordinate with the nuclear medicine department to standardize series export and ensure the availability of the "attenuation corrected" series.
Have you already tried it? If you have any questions, our team of experts is ready to help you in the Eden PACS support chat, or via email at soporte@edenmed.com
No papers match your search.